Using AI assistance to create Power BI custom visuals
This article is about a process to use AI tools like LLMs to create custom visuals in Power BI, and how this still requires deliberate thought, planning, and learning. Read more
This article is about a process to use AI tools like LLMs to create custom visuals in Power BI, and how this still requires deliberate thought, planning, and learning. Read more
Visual calculations are useful for performing calculations specific to a visual. Conditional formatting is a great example of this concept. In this article, we show how to easily implement conditional formatting through visual calculations. Read more
As one of the founders of OKVIZ—a company dedicated to producing custom visuals—I have been following the recent developments in Power BI Desktop with particular concern. This issue, however, extends beyond our company and affects many other organizations that rely… Read more
This article describes an Accounts Receivable Aging report in Power BI, and shows how to simplify a business problem using existing modeling patterns. Read more
The cumulative total pattern allows you to perform calculations such as running totals You can use it to implement warehouse stock and balance sheet calculations using the original transactions instead of using snapshots of data over time For example in… More on DAX Patterns

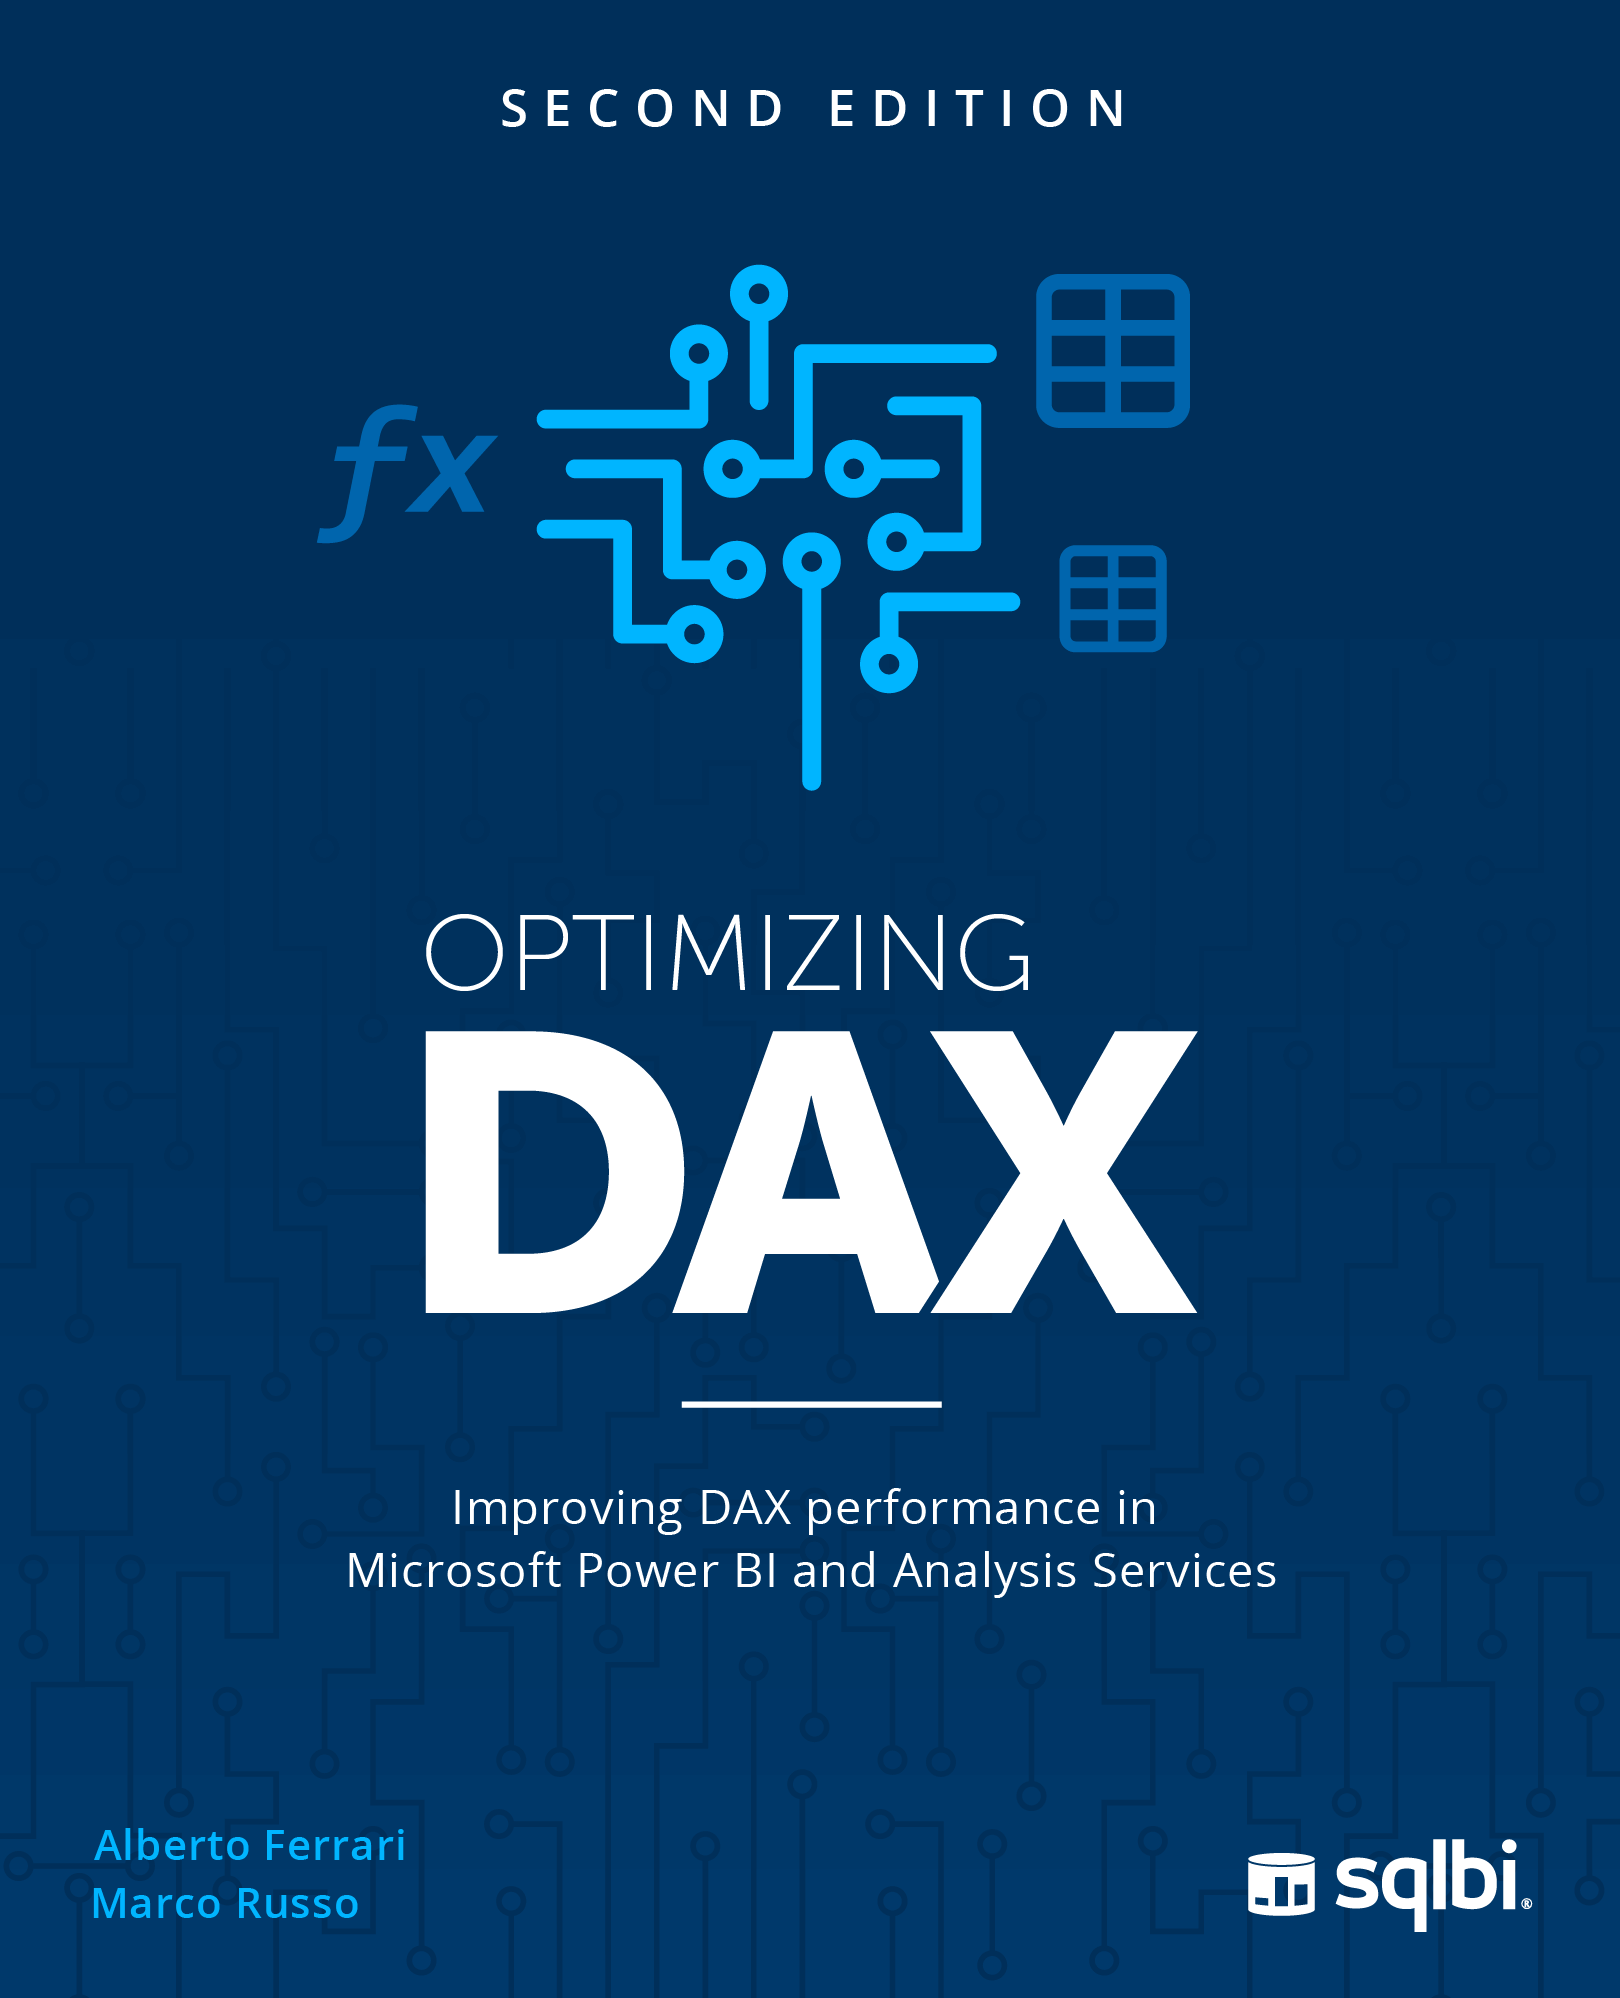
Optimizing DAX is the state-of-the-art book on optimizing DAX expressions in Power BI and Analysis Services semantic models.
Learn how to locate performance bottlenecks, read the query plan and performance metrics, rewrite the slower part of an expression, and measure the performance improvements. Read more