-
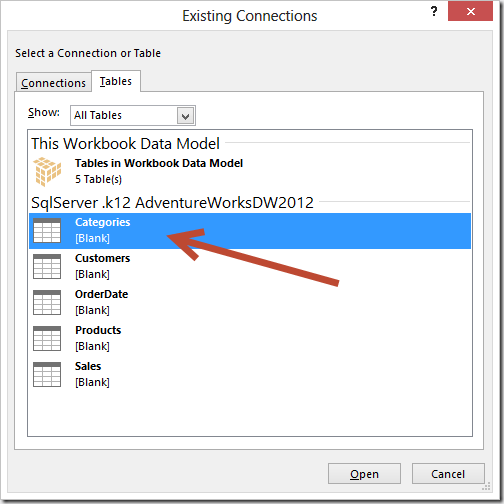
In PowerPivot for Excel 2010 it is possible to import an Excel table in a PowerPivot data model by using the Linked Table feature. Excel 2013 expands this capability by Read more
-
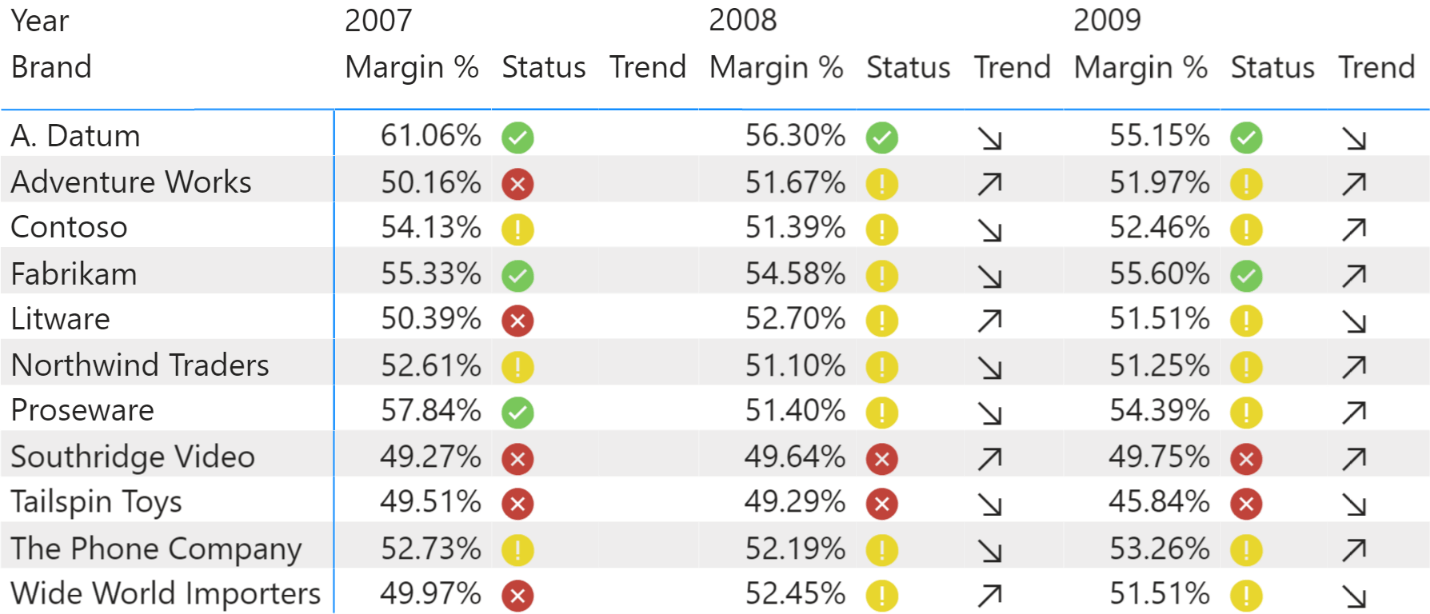
A Tabular model can define a measure as a Key Performance Indicator (KPI), thus providing a visual indicator for status and trend. This article describes in detail the KPI settings needed to get the best result using Power BI and… Read more
-
Year-To-Date and Difference-Over-Previos-Year (or Year-Over-Year Growth) are among the most required features of any user. Some OLAP client (like ProClarity) offers features that try to solve this problem client-side, but I don’t like this approach given that you might have… Read more
-
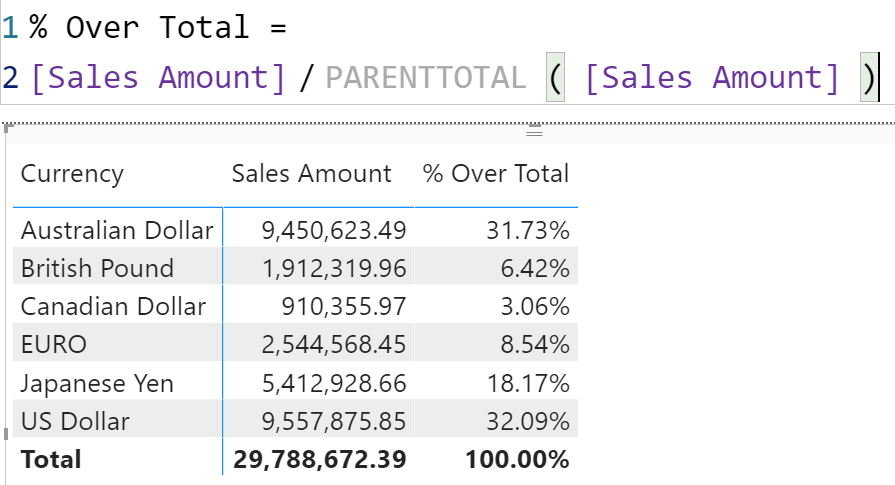
In this article, we share an idea to reduce the friction in using Power BI, by extending the DAX language with new visual calculations. Read more
-
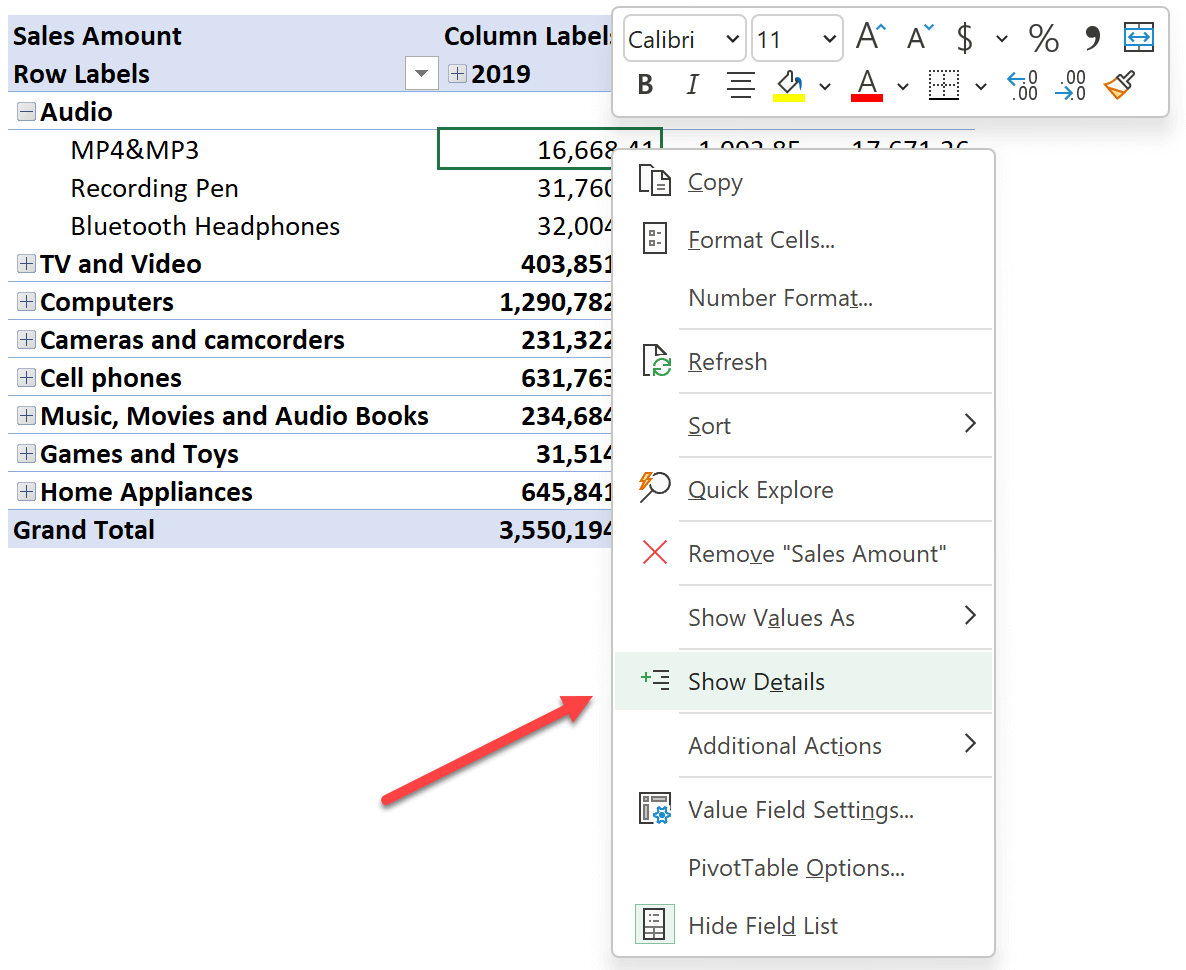
This article describes how to customize the drillthrough experience in Excel PivotTables connected to Power BI datasets or Analysis Services databases. Read more
-
This article describes the reasons why an Excel pivot table may be slow when using the Analyze in Excel feature of Power BI. Read more
-
In many workshops and sessions about PowerPivot the most frequently asked question has always been: how can I automate the PowerPivot Data Refresh in Excel? I talked about that a few weeks ago. Read more
-
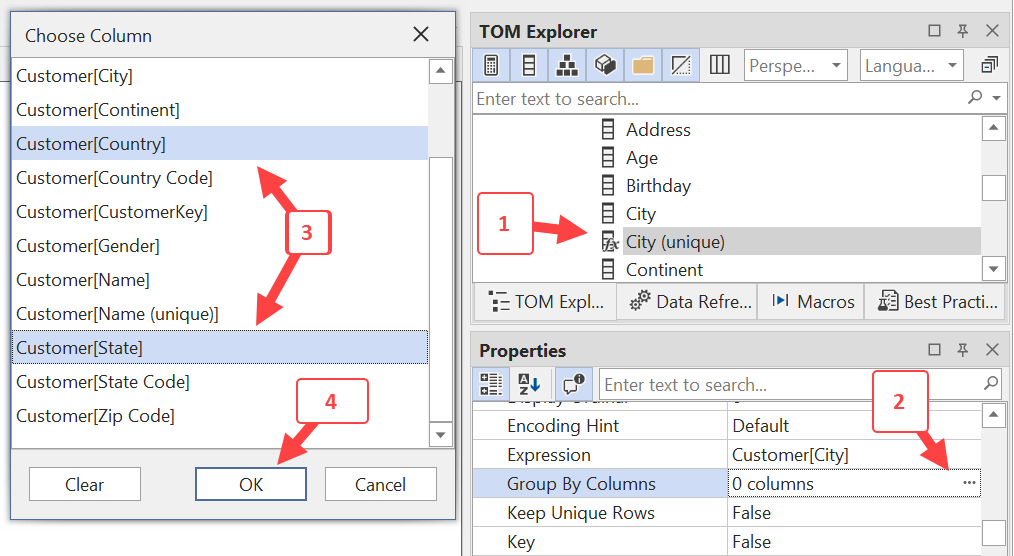
This article describes how Power BI uses the Group By Columns attribute of a column and how you can leverage it in specific scenarios. Read more
-
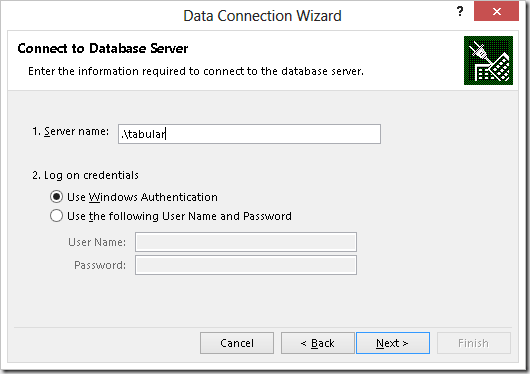
When you use Excel to connect to a Tabular database in Analysis Services, you get a PivotTable as a result. In this article, you learn how to import data in a table writing a DAX query than runs on Analysis… Read more
-
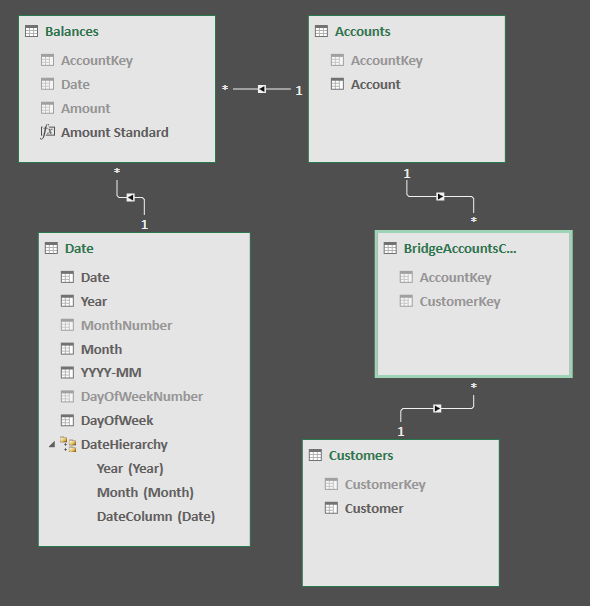
The new DAX available in Excel 2016 and the data model in Power BI and Analysis Services 2016 offer tools to manage many-to-many relationships in a more efficient way than previous version, as described in this article. Read more
