-
Today (September 30, 2015) is the last day to submit an entry in the Power BI Best Visual contest. I and Daniele Perilli (who has the skills to design and implement UI) spent hours thinking about something that would have… Read more
-
article
The Space Report Under the Hood
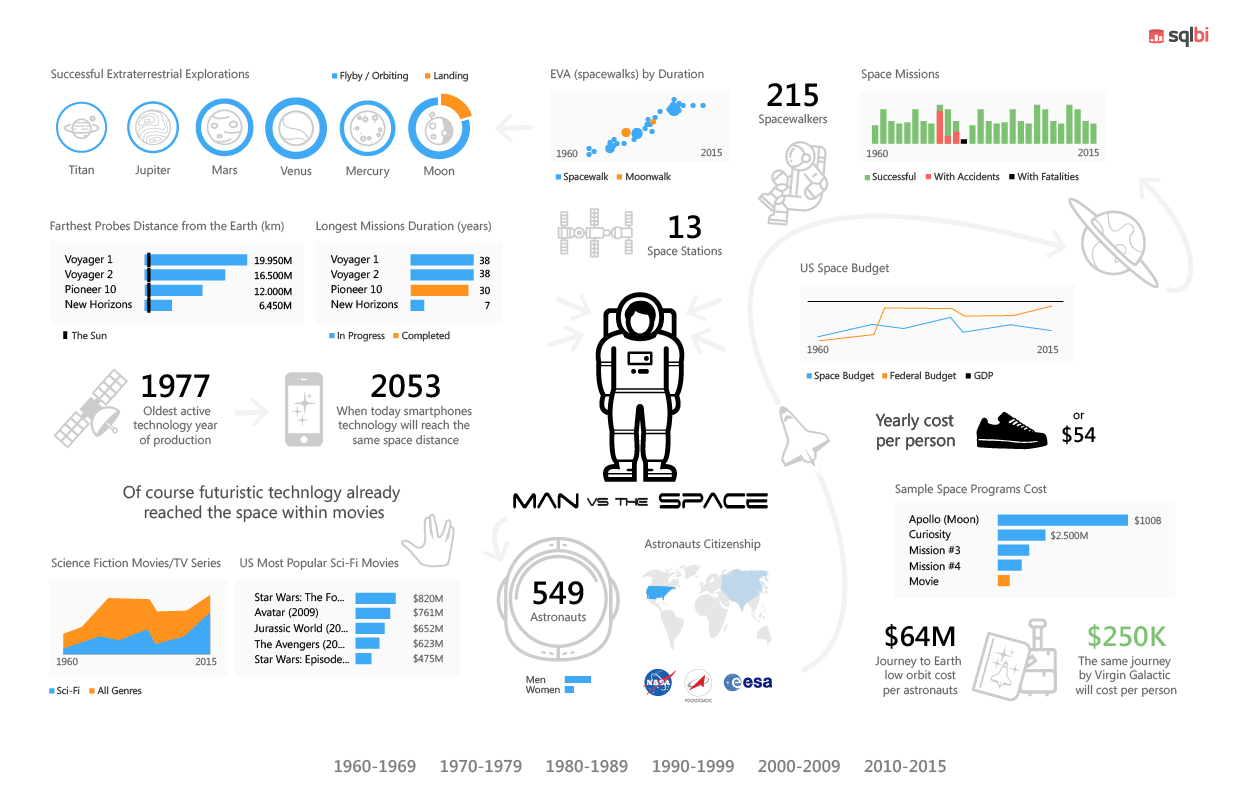
The infographic “Space Report” submitted to the Best Report Contest in Power BI is not only a collection of nice charts and graphics. There are several little gems implemented to overcome certain limitations, as you will read in this article. Read more
-
This content is exclusive to SQLBI+ subscribers. Watch now
-
Last week Amir Netz presented in the Power BI blog a detailed introduction to the Synoptic Panel written by Daniele Perilli. This component won Power BI best visual contest in October, but since then we received many feedback and Daniele… Read more
-
This content is exclusive to SQLBI+ subscribers. Watch now
-
This content is exclusive to SQLBI+ subscribers. Watch now
-
This content is exclusive to SQLBI+ subscribers. Watch now
-
This content is exclusive to SQLBI+ subscribers. Watch now
-
This content is exclusive to SQLBI+ subscribers. Watch now
-
Optimizing DAX Video Course
Optimizing common DAX constructs: Different ways of performing a distinct count
…up to the last date available in the feeder contest…. Watch now
