-
This article is the state-of-the-art guide of the development tools for Power BI and Analysis Services models, providing guidance to improve productivity and access to new features. Read more
-
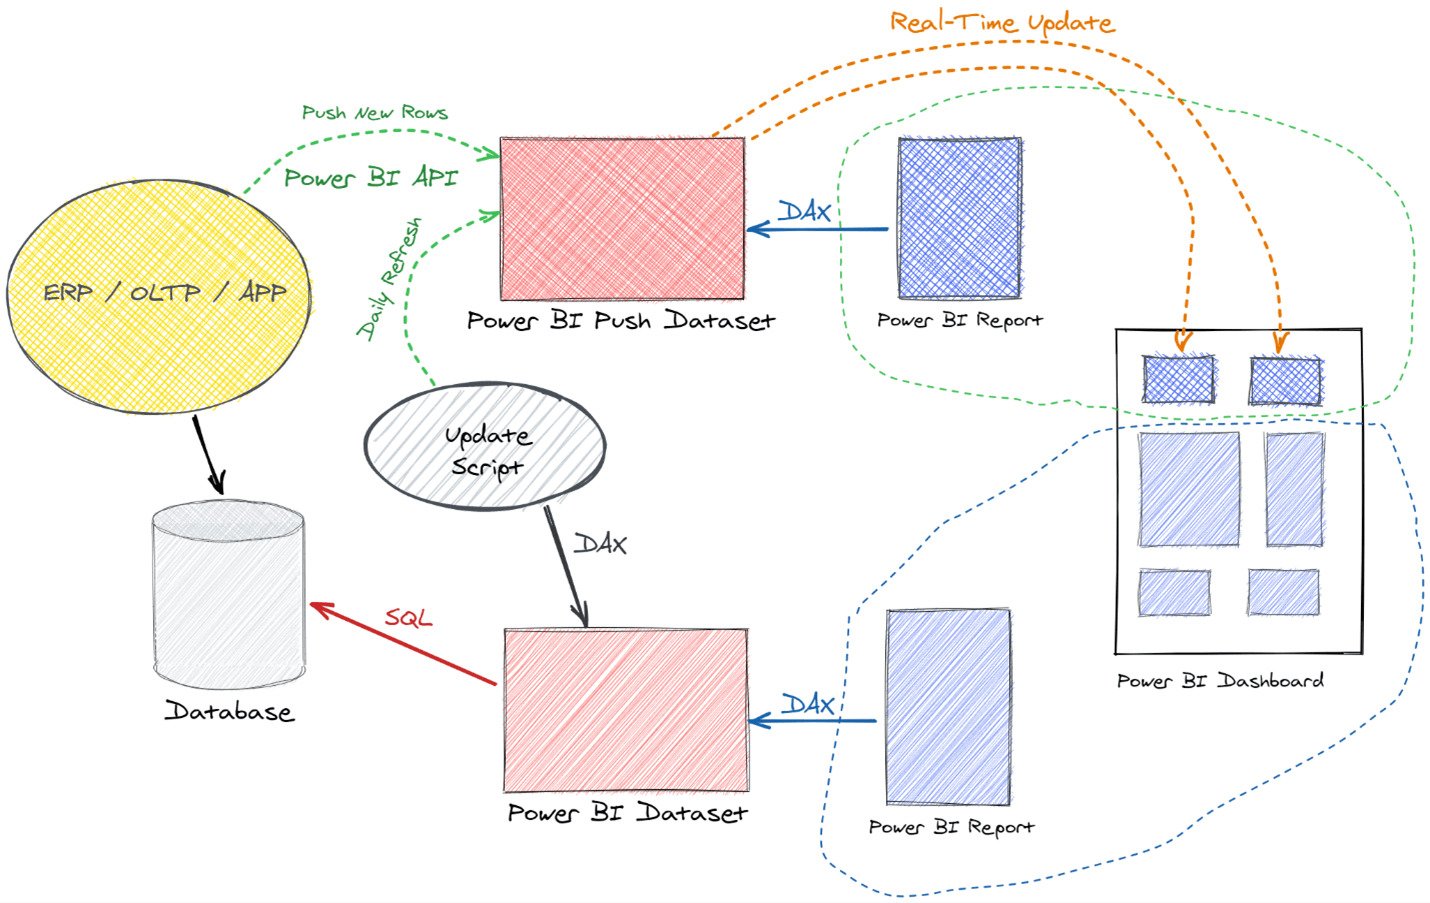
Push datasets are an efficient and inexpensive way to implement real-time updates in Power BI reports and dashboards. They can provide better performance and scalability than DirectQuery at the price of a small development cost. Read more
-
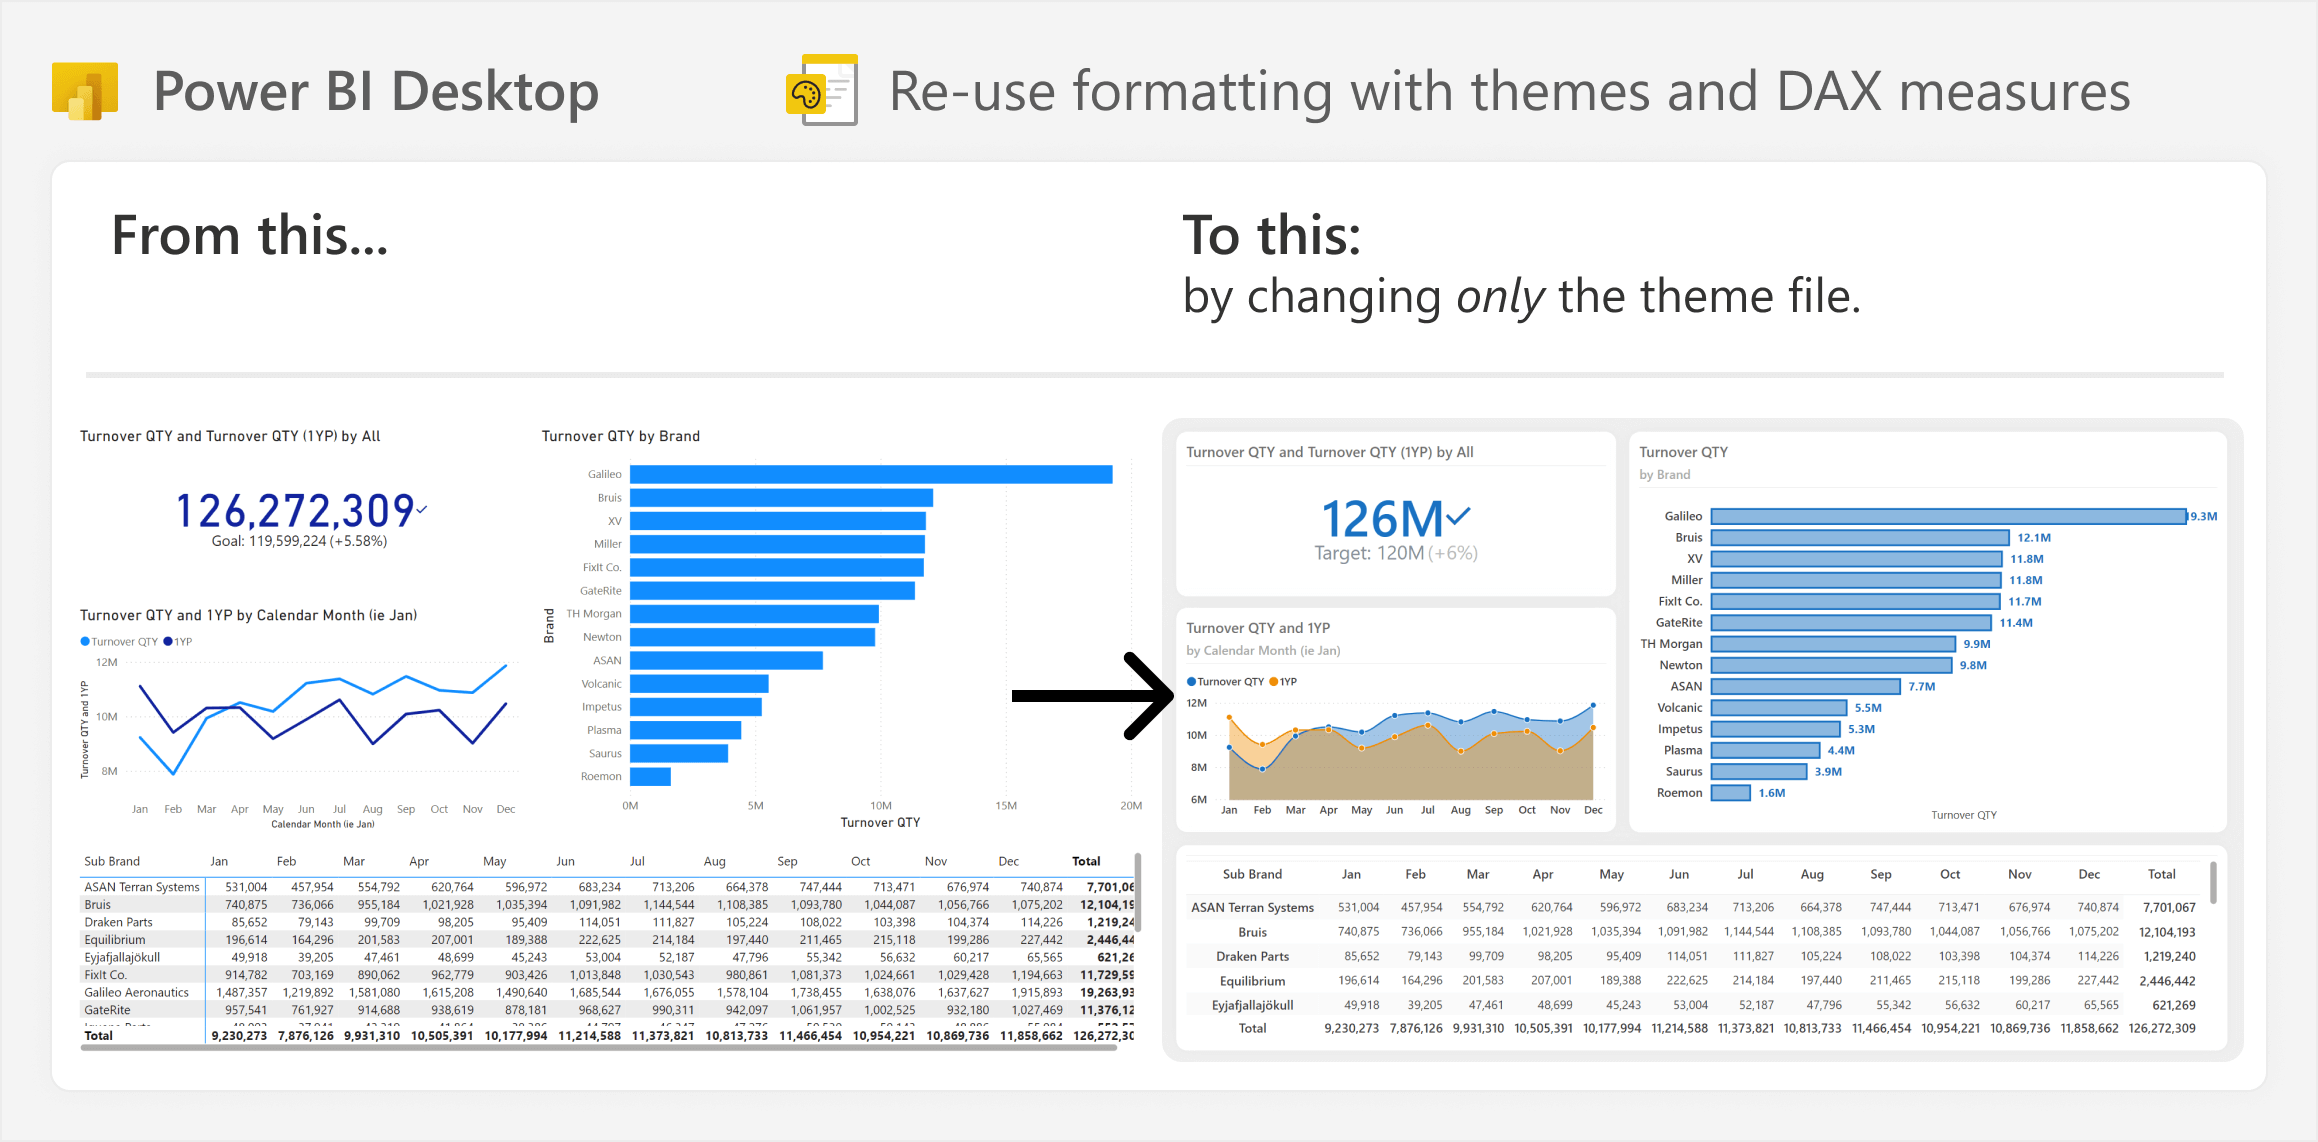
This article is about how you can save time when building and maintaining Power BI reports by using strategies to re-use visual formatting. Read more
-
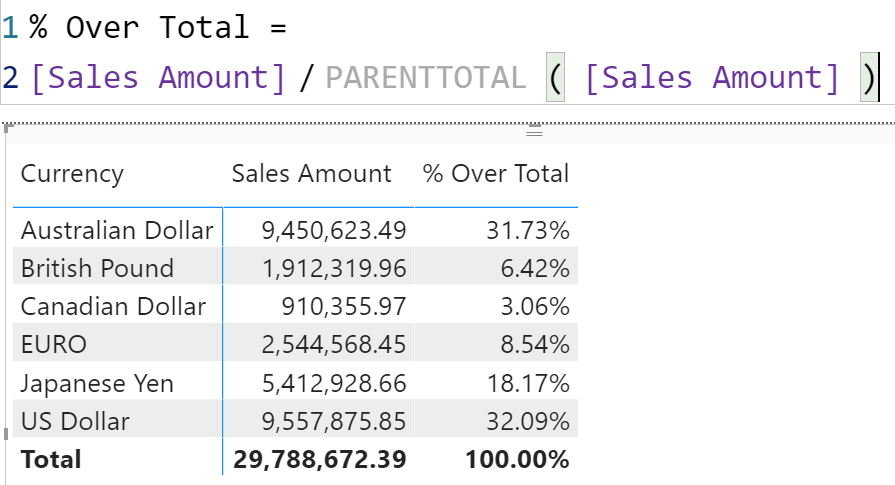
In this article, we share an idea to reduce the friction in using Power BI, by extending the DAX language with new visual calculations. Read more
-
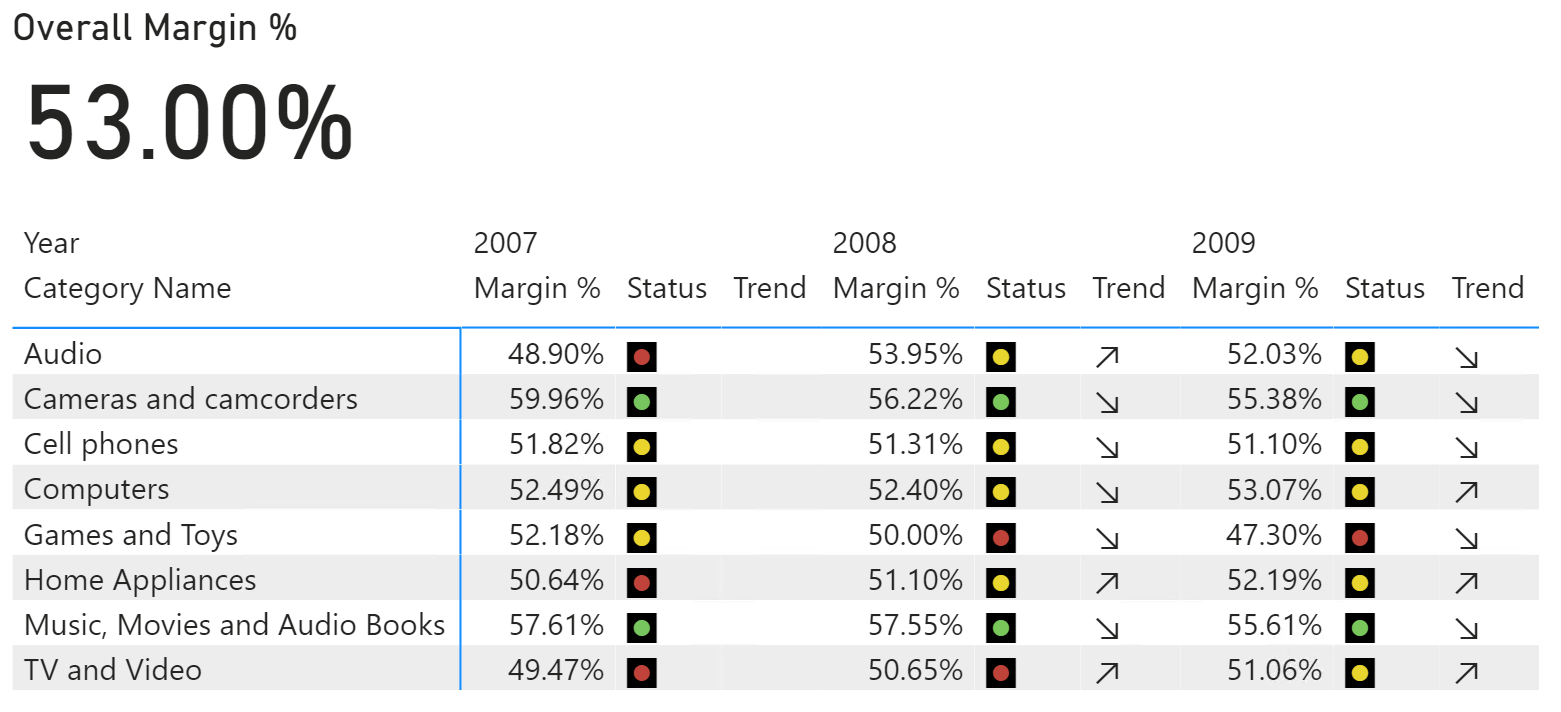
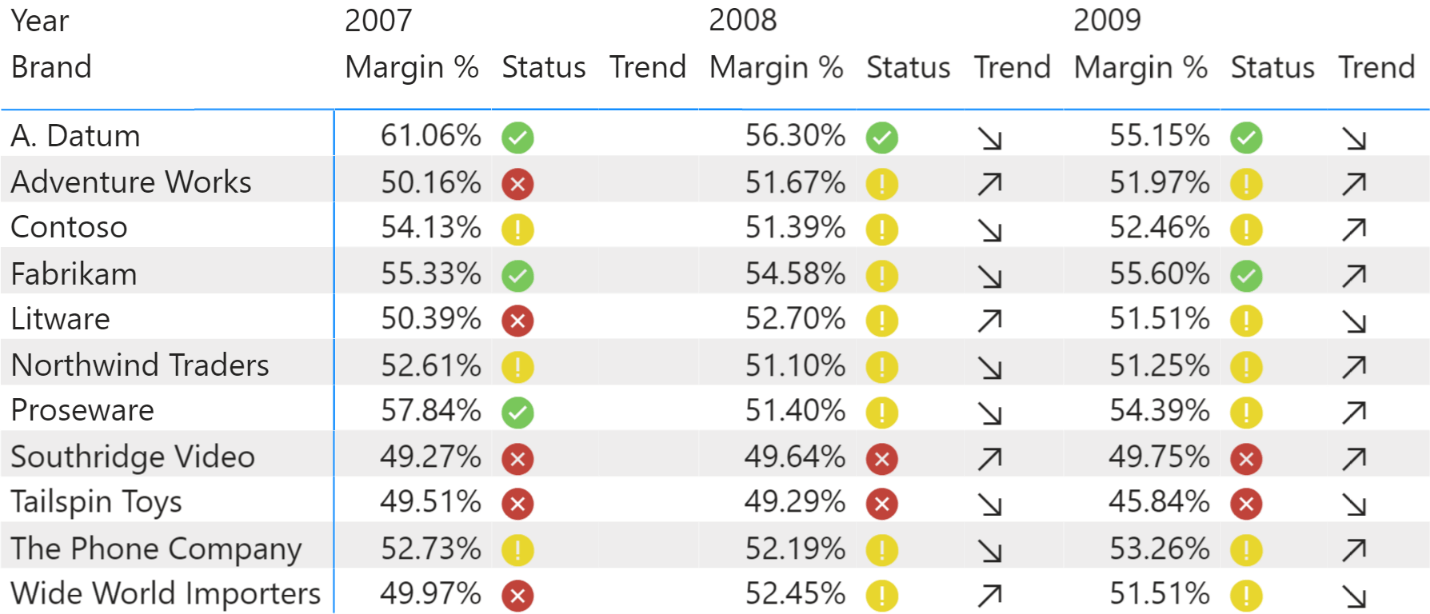
This article describes how to create Key Performance Indicators (KPI) in a Power BI Desktop data model by using Tabular Editor. Read more
-
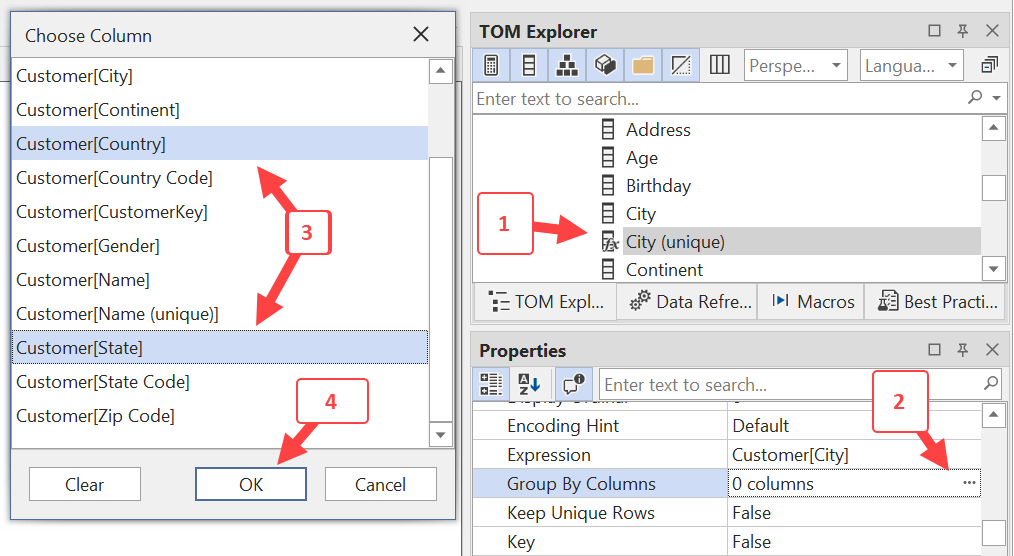
This article describes how Power BI uses the Group By Columns attribute of a column and how you can leverage it in specific scenarios. Read more
-
Though you can build real-time reports with DirectQuery, push datasets offer a more scalable, economical, and effective solution especially when combined with an Import model already in place. In this article we introduce the architecture of push datasets. Read more
-
A Tabular model can define a measure as a Key Performance Indicator (KPI), thus providing a visual indicator for status and trend. This article describes in detail the KPI settings needed to get the best result using Power BI and… Read more
-
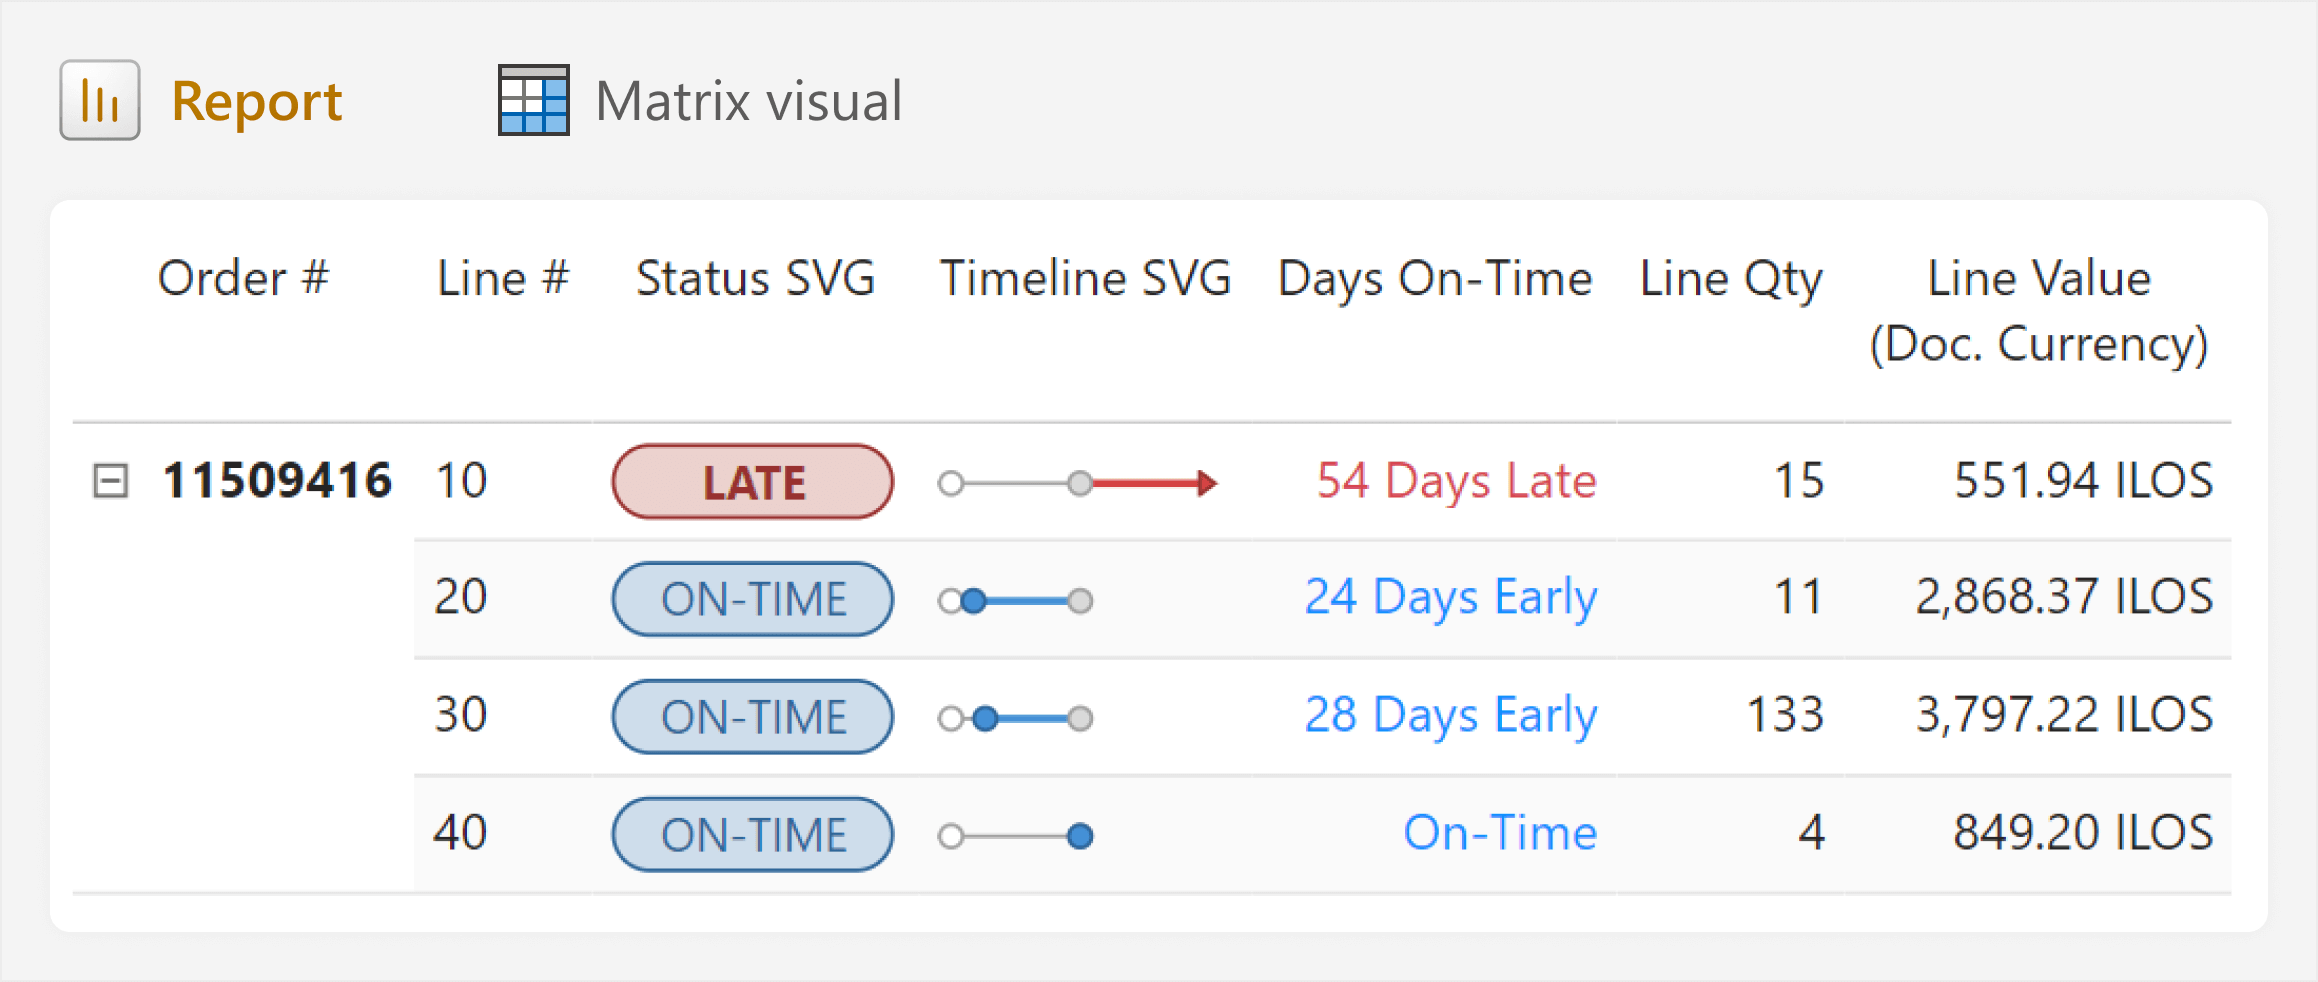
This article is about creating dynamic images in DAX measures to visualize data in tables or cards, including an easy way to do this in Figma, and a caution for using these DAX measures in real-life scenarios. Read more
-
When you create a data model in Power BI, you should consider how to properly use naming convention and what columns to include, in order to improve usability and performance. This article provides a quick list of best practices valid… Read more

