-
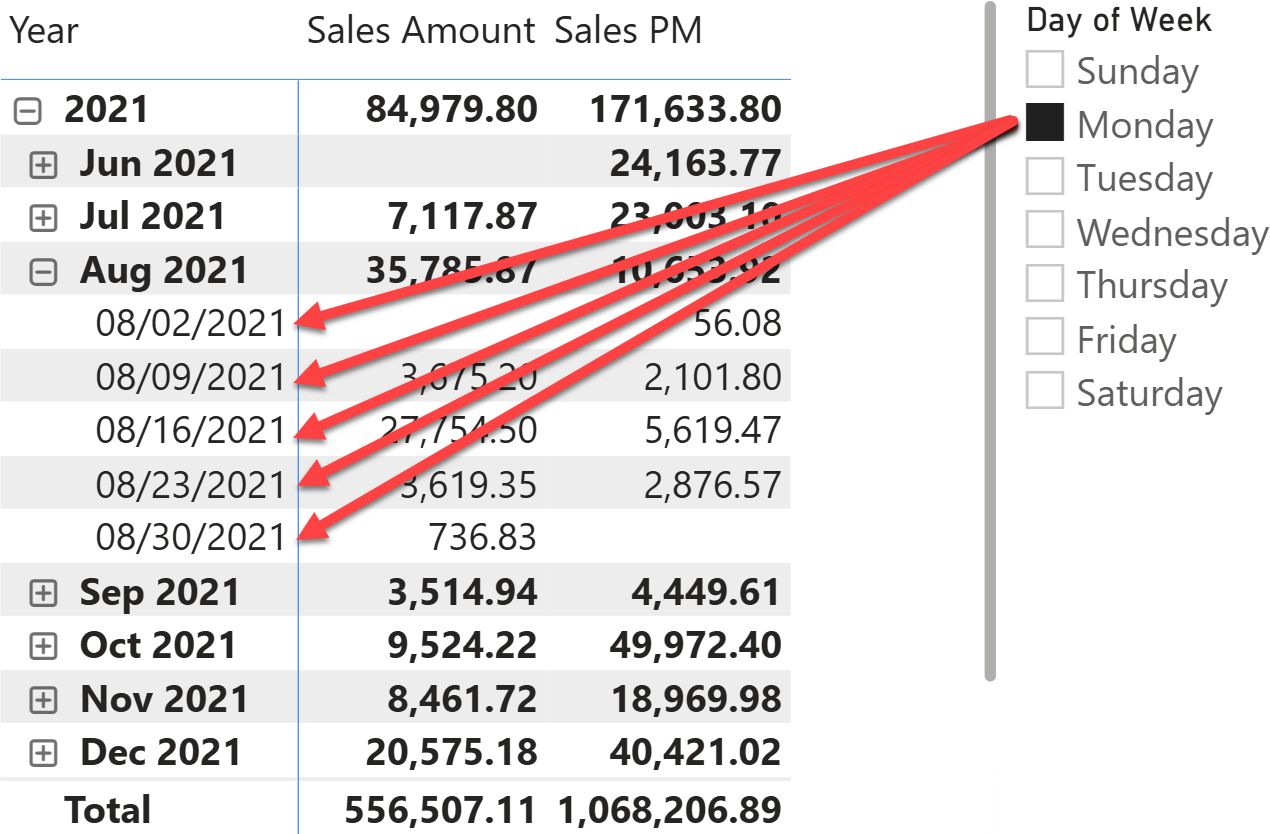
When using time intelligence functions, the automatic REMOVEFILTERS on Date can make maintaining filters on the Date table challenging. This article shows a technique to handle filter-preserving columns in DAX. Read more
-
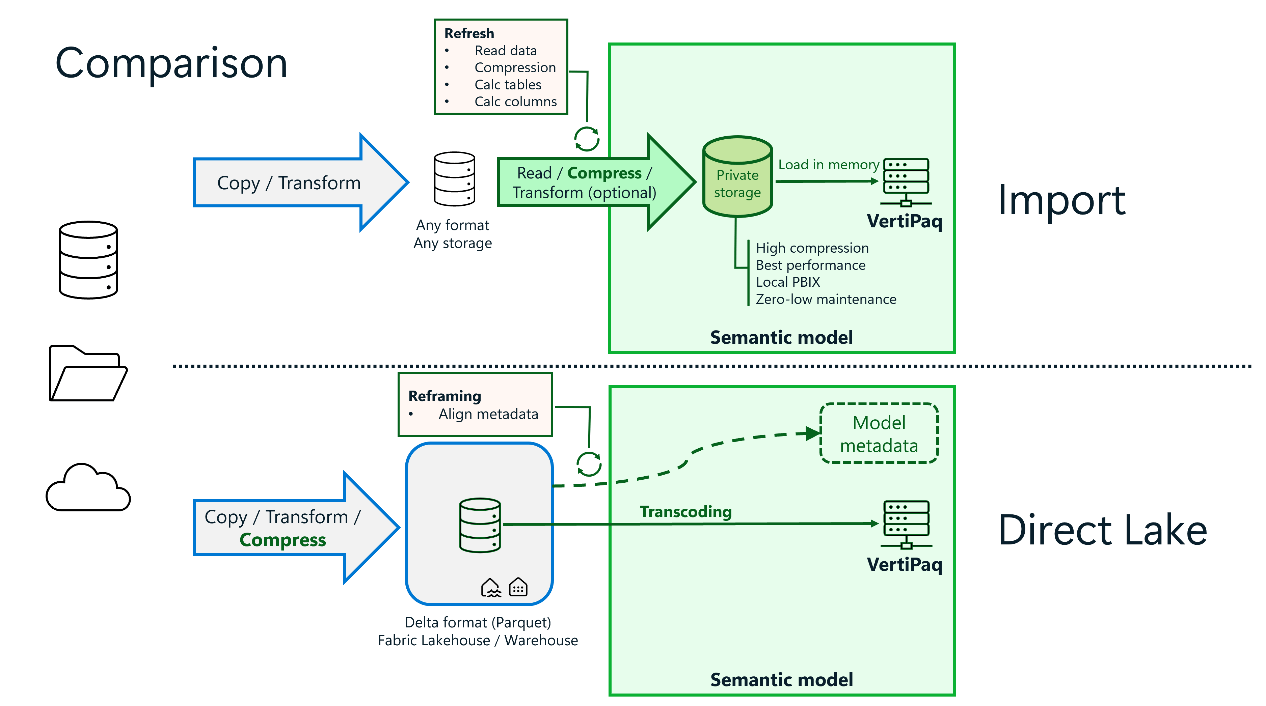
I usually do not write about announcements and new features until we have had time to try and test them in the real world. However, there are always exceptions, and some of the announcements at the Microsoft Fabric Conference 2025… Read more
-
This article is about a process to use AI tools like LLMs to create custom visuals in Power BI, and how this still requires deliberate thought, planning, and learning. Read more
-
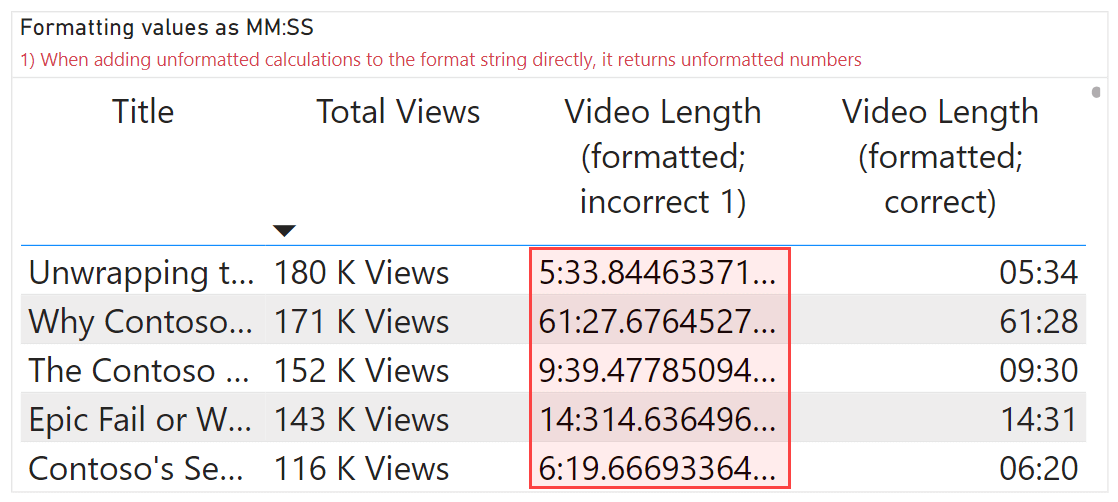
This article describes the different approaches to format your DAX measures in Power BI semantic models using custom and dynamic format strings. Read more
-
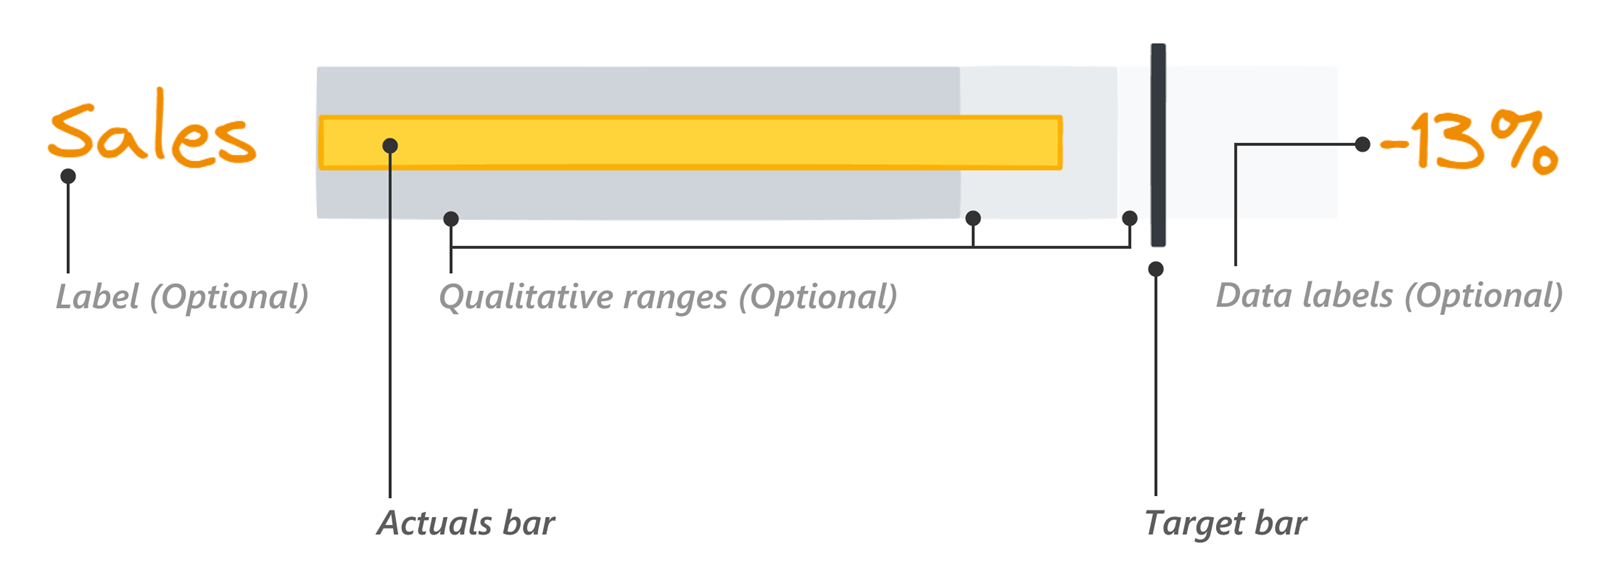
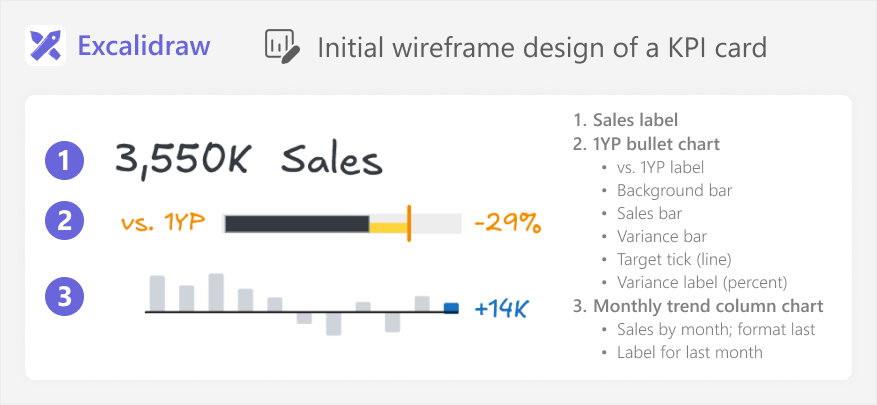
This article is about how to read and use bullet charts when comparing actuals to a target in Power BI, and the different options you have available to make these charts in Power BI reports. Read more
-
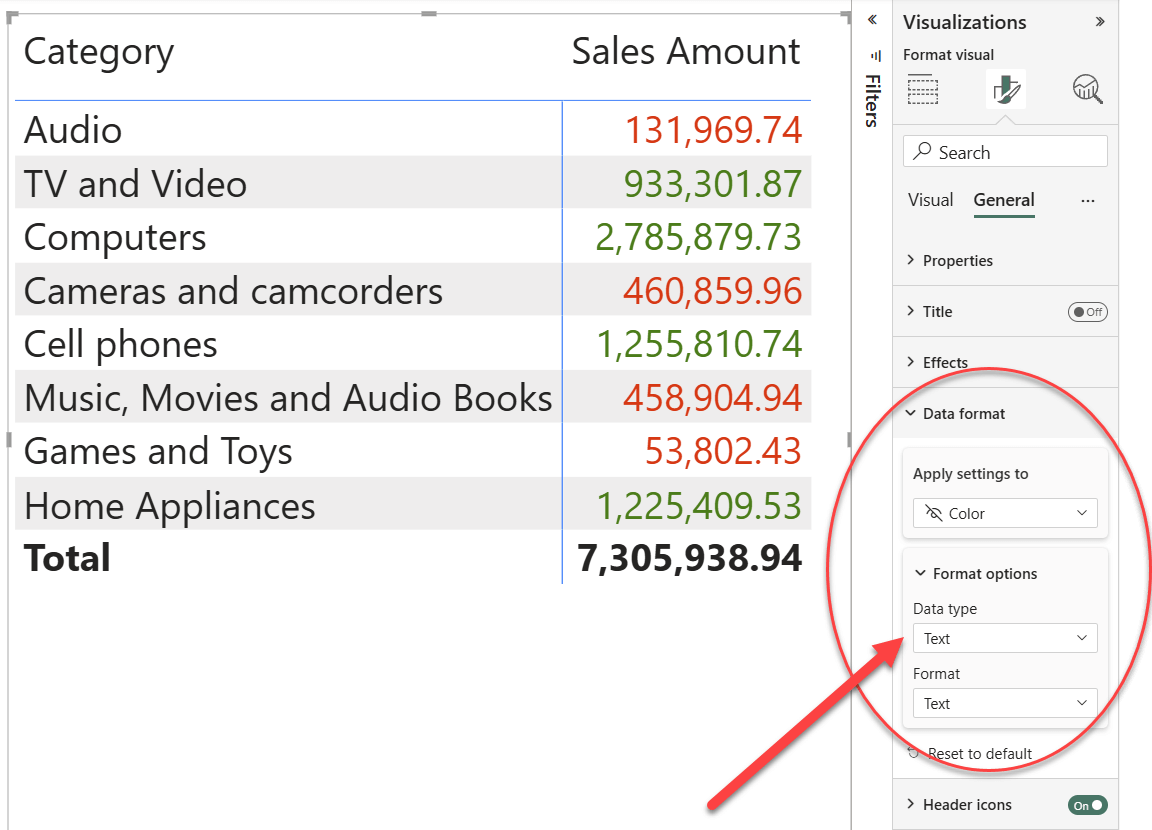
Visual calculations are useful for performing calculations specific to a visual. Conditional formatting is a great example of this concept. In this article, we show how to easily implement conditional formatting through visual calculations. Read more
-

As one of the founders of OKVIZ—a company dedicated to producing custom visuals—I have been following the recent developments in Power BI Desktop with particular concern. This issue, however, extends beyond our company and affects many other organizations that rely… Read more
-
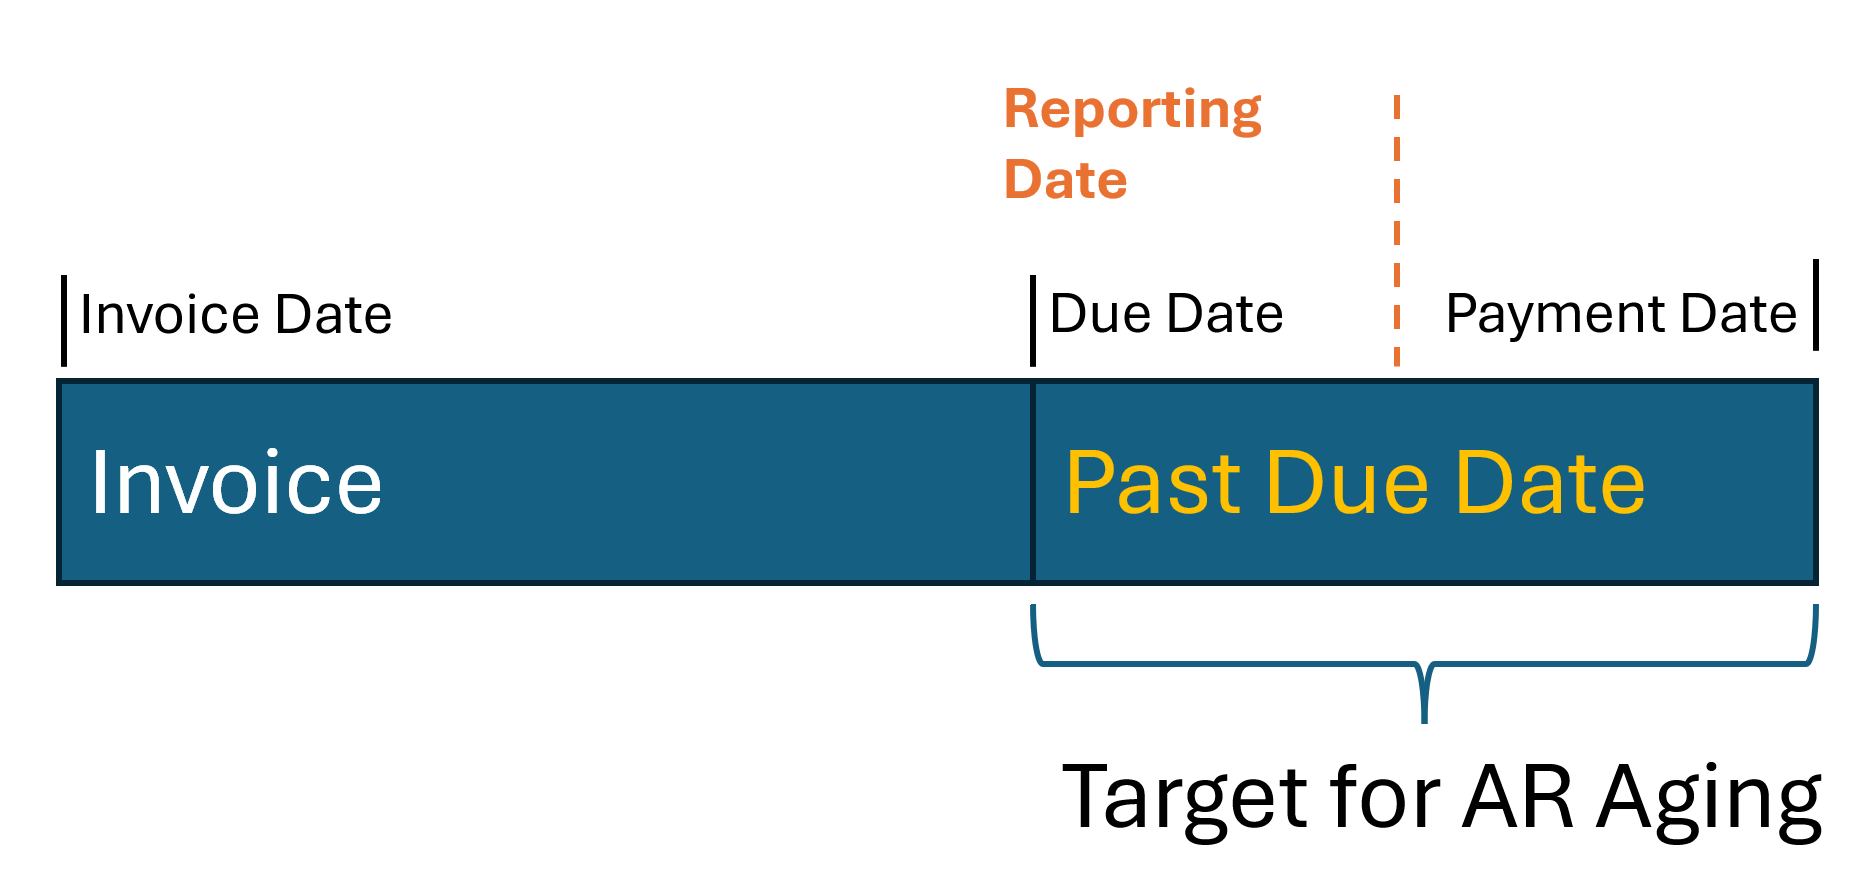
This article describes an Accounts Receivable Aging report in Power BI, and shows how to simplify a business problem using existing modeling patterns. Read more
-
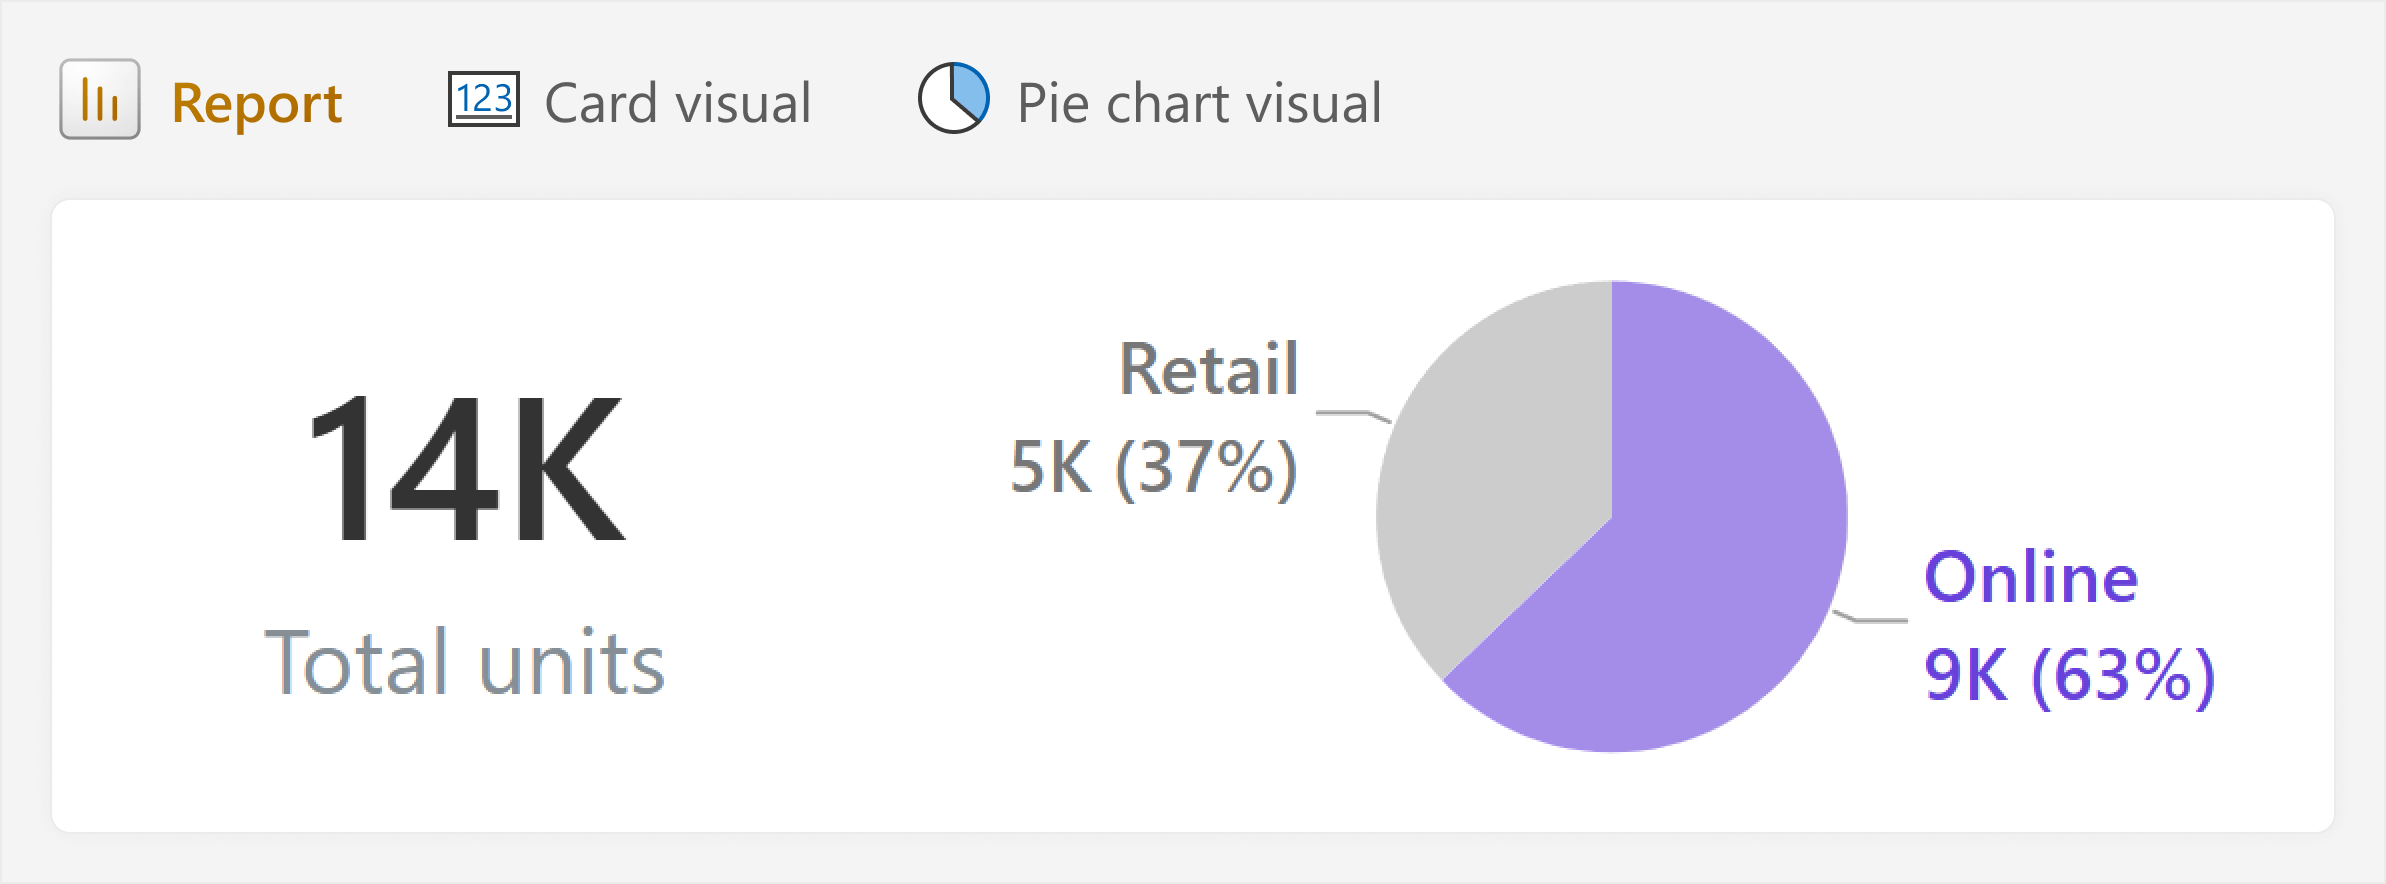
This article is about how rules like “avoid pie charts” can be useful for beginners, but also unhelpful in real-world scenarios with more nuance. Instead of learning rules about “how”, try to understand the “why”. Read more
-
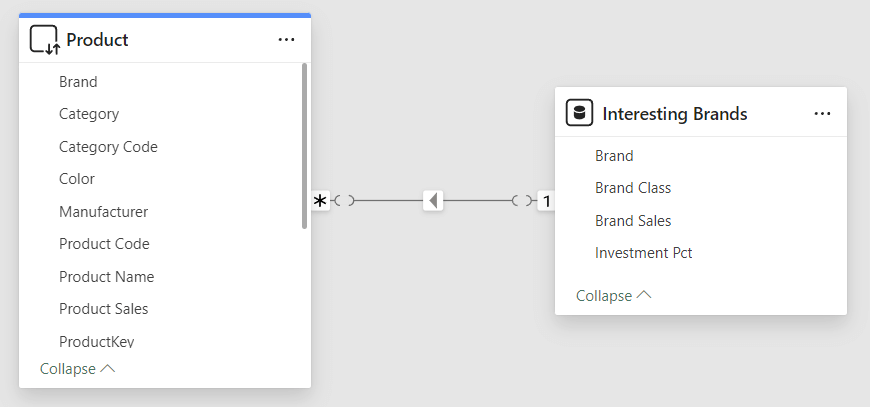
This article describes the differences between the ALL and CROSSFILTERED functions in DAX. Read more