Handling missing dates in a semantic model can be challenging, especially when working with DAX time intelligence functions. Dates might be missing for various reasons: incomplete data entry, system errors, special placeholder values like 0000, or dates set far in the future. We will see that using a blank is the best way to manage missing dates, even though you should pay attention to DAX conditional expressions operating on those dates. We will also consider how to hide these blanks in a Power BI report if their presence is not desired in charts and slicers.
Understanding missing dates
A missing date is an expected situation and not an error: for example, the Sales table we often use in Contoso has two date columns: Order Date and Delivery Date. While the Order Date is always present, the Delivery Date is unavailable until the order is shipped. In the many examples we use in our articles, we only have rows from Sales that describe shipped orders – therefore, both dates are available.
But for example in the demo file, all the orders received from April 2024 have not been shipped, so their Delivery Date is blank.

In a future refresh of the same model, some of those transactions will have a valid delivery date, but having rows without a value for one or more dates is something we should consider as a regular condition in this model.
You can observe a similar situation for subscriptions, contracts, or any other business entities where the presence of a value in several rows of a date column is not mandatory. However, the presence of the blank has several side effects in the semantic model that we will describe soon. Before doing so, we want to examine why keeping a blank value is better than other alternatives.
Alternative to blank dates
If you have a blank value that is on the many-side of a one-to-many relationship, there will be an additional blank row on the one-side of the relationship. For the Date table, it means that there will be a blank date – which could not be ideal for the user experience, but we will examine this problem later. Before doing so, let us evaluate the possible alternatives.
First, we could have a special placeholder value. If the date is stored as an integer number or as a string in the format YYYYMMDD, the date 3/23/2024 is represented as 20240323. The missing date could be represented by 00000000, which is also an invalid number for day and month. If such value exists in the Date table, it should have special values for columns like year, day, and month (like blank, 0, or other). However, if the Date table has a Date column, then that column (also used in DAX time intelligence functions) should be either an actual date, or the blank generated by the blank row for an invalid relationship. We are just moving the problem to another column without solving all the issues. If you want to use the DAX time intelligence functions, you need a date column, and you cannot use a special placeholder value there without using an actual date. If you use blank, you are not using an alternative!
Another option is to use a date in the far future, like the last day of 2199 in the following example.

In this case, the Date table could have a row corresponding to that date. Otherwise, you will have the blank row again on the Date table. Thus, assuming you want to avoid the blank row in Date, you should face other side effects:
- If the special date has no other dates for the same year, it violates the assumptions required for the DAX time intelligence functions (all years must be complete with all the dates, or the result could be incorrect).
- If the Date table is created using a calculated table that automatically detects the range of dates (like the CALENDARAUTO function), then the Date table will include all the years and all the days until that date far in the future. For example, by setting a date in the year 2199, we get more than 65,000 rows in the Date If you used a date in 9999, you would have more than 64 million rows in the Date table. That would be inconvenient, to say the least!
Therefore, using a blank value is a better choice: it better represents the actual state (the absence of information, since that date is not defined), and it matches the behavior in the Date table, which will include an additional blank row without polluting the calendar with unused dates.
Blank dates and the Date table
The best practice for a semantic model is a single Date table with a one-to-many relationship with all the date columns that users may want to aggregate. In our example, the Date table is related to Order Date (active relationship) and Delivery Date (inactive relationship) in Sales.
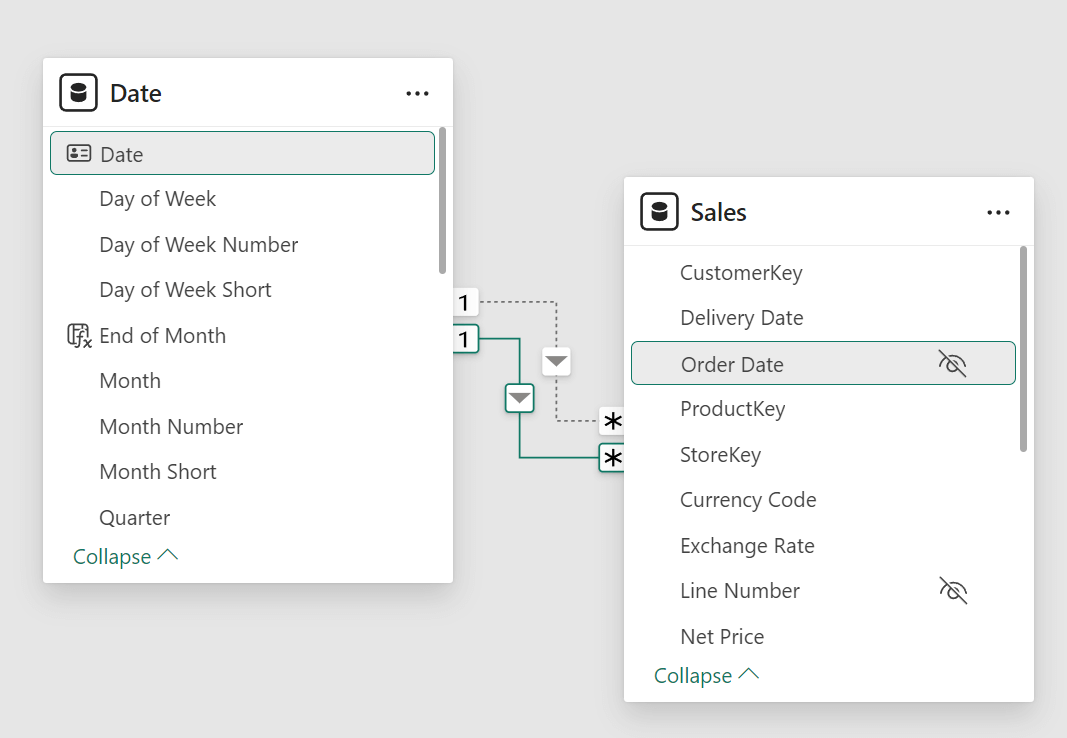
The model has the Sales Amount and Delivered Sales measures, which can be combined in the same visual:
Sales Amount = SUMX ( Sales, Sales[Quantity] * Sales[Net Price] )
Delivered Sales =
CALCULATE (
    [Sales Amount],
    USERELATIONSHIP ( Sales[Delivery Date], 'Date'[Date] )
)
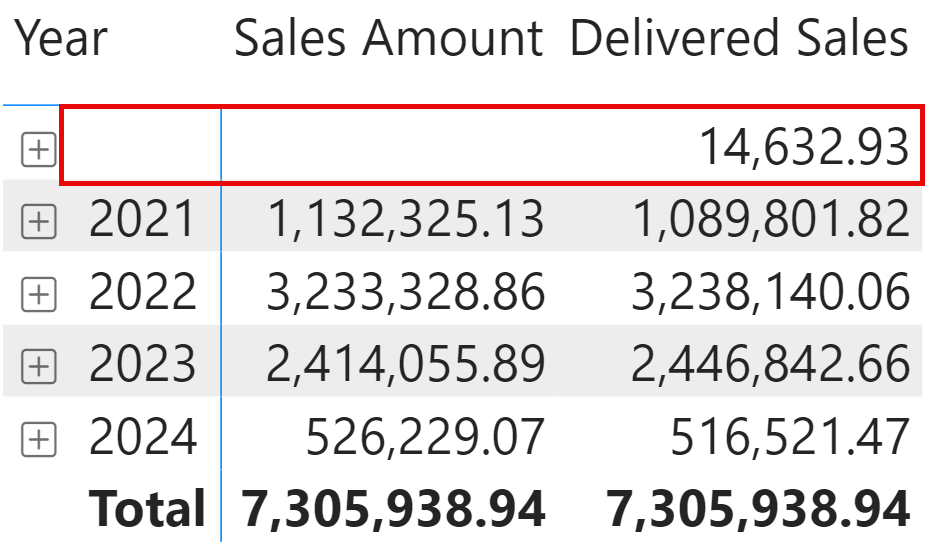
The amount not delivered is 14,632.93, assigned to an empty year. The Date table does not have any row with a blank year: that row is the blank row added to an invalid relationship (see Blank row in DAX). The presence of a blank date in Sales[Delivery Date] generated the “invalid” state of the relationship. This state is not necessarily bad for the model, because we do not really have a good alternative to represent a transaction that has not been delivered yet. However, we must be ready to deal with the presence of this blank because it could create confusion for the user and generate inaccurate results if we do not consider this condition in the DAX measures.
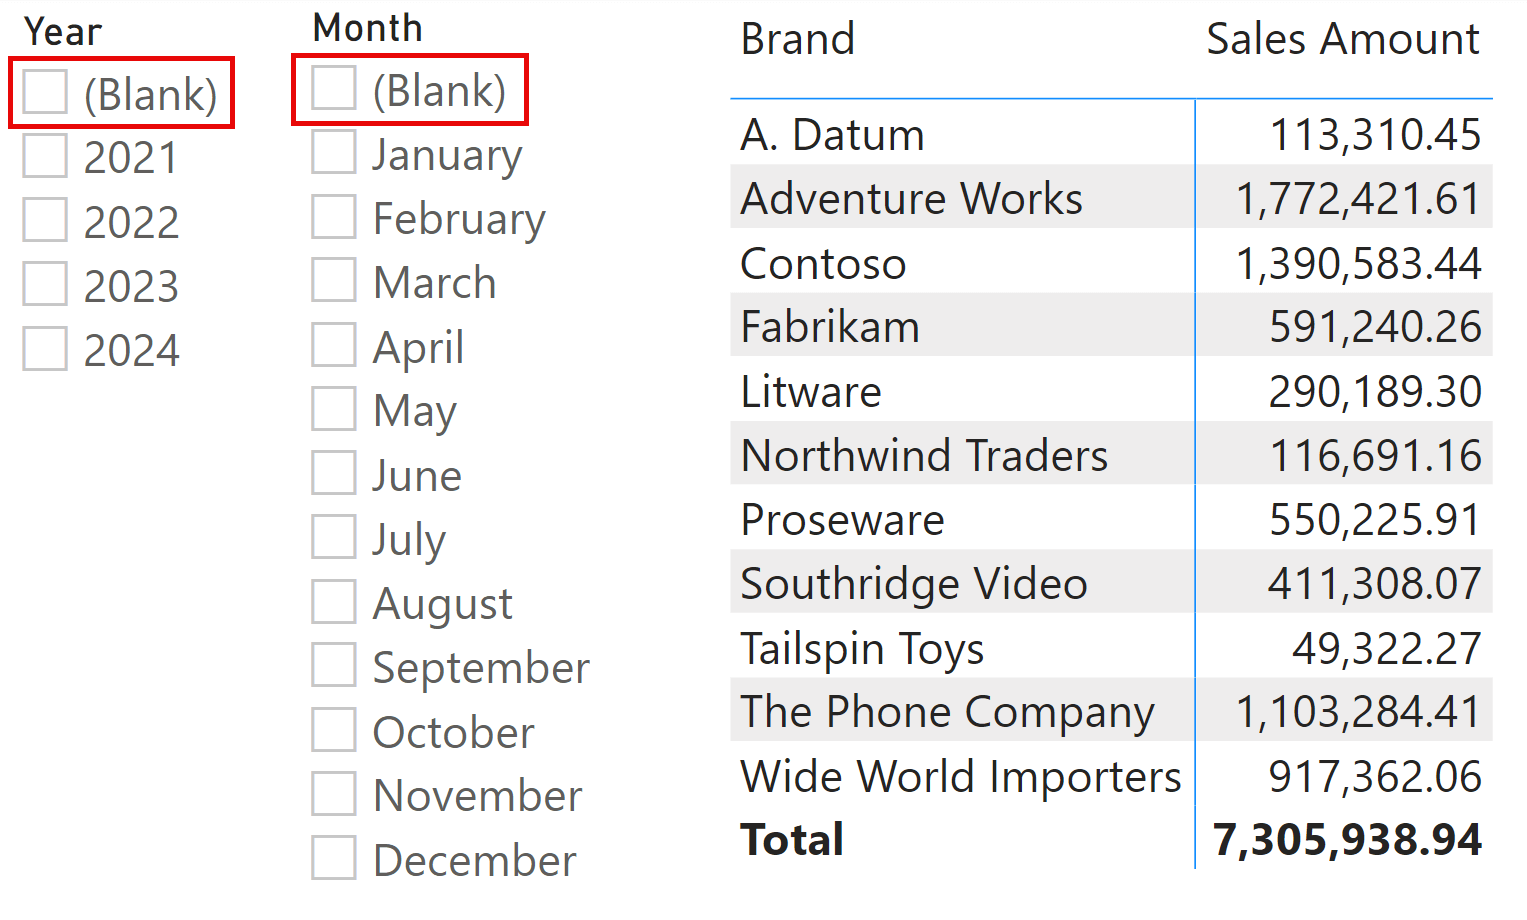
For example, in the user interface, any slicer from Date (like Year and Month) will include a blank row. In the following report, any selection of blank from Year or Month produces an empty report because there are no sales without an Order Date. However, although the report does not show the Delivery Date measure and never uses the relationship between Delivery Date and Date, the presence of a blank in Sales[Delivery Date] generates the blank row in Date because of the existing inactive relationship.
If you want to hide the blank row from the report users, you have two alternatives: adding filters in the report or modifying the model.
Hiding blanks from Date in the reports
You can remove blank rows in a slicer by adding a filter condition to the slicer or to the entire page. If you work on the filters of the slicer visual, you do not have side effects on other report visuals.
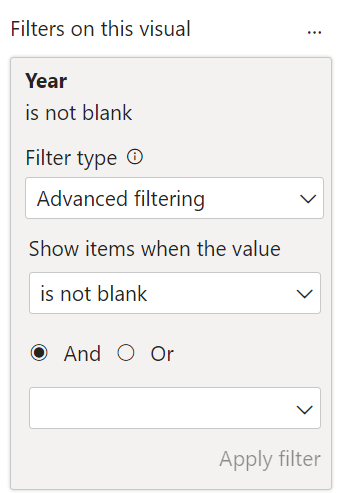
Another approach could be to hide the blank date from the report page, without having to edit each visual. In this case, it is a good idea to filter out the blank in Date[Date], so it propagates to all the other columns of the Date table without hiding a legitimate blank in other columns (e.g., holiday name).
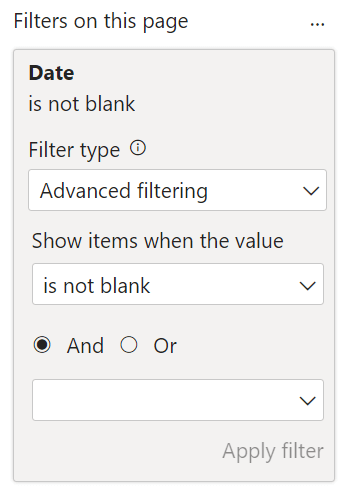
However, by filtering the page, you filter all the visuals, even when no selections are made on any slicer. Therefore, there is an impact on measures that use the relationship from Delivery Date, like Delivered Sales: we hide all the sales without a delivery date in the Delivered Sales measure. For example, in the following report, the difference between Sales Amount and Delivered Sales is the amount of orders not delivered, displayed in the Undelivered Sales measure.
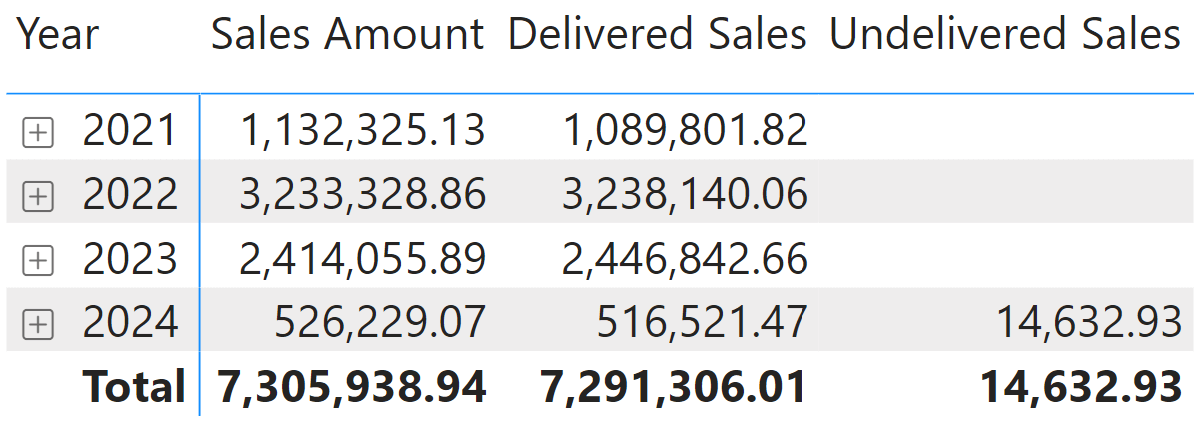
The Undelivered Sales measure simply filters the transactions with an empty Delivery Date. In this case, USERELATIONSHIP is not used, and the active relationship is always with Sales[Order Date]:
Undelivered Sales =
CALCULATE (
    [Sales Amount],
    ISBLANK ( Sales[Delivery Date] )
)
Creating a measure is not really necessary unless you want to show that amount in a visual with other measures that use the existing relationships.
Hiding blanks from Date in the model
For completeness, we also describe another option with several negative side effects. While we do not endorse this technique, we want to explain why it could backfire in multiple ways.
Because the blank row is added to the Date table because of an invalid regular relationship, we can change the relationship type to a limited relationship, which cannot have an invalid state. For example, instead of using one-to-many relationships between Date and Sales, we could use many-to-many cardinality relationships with a single direction filter from Date to Sales.
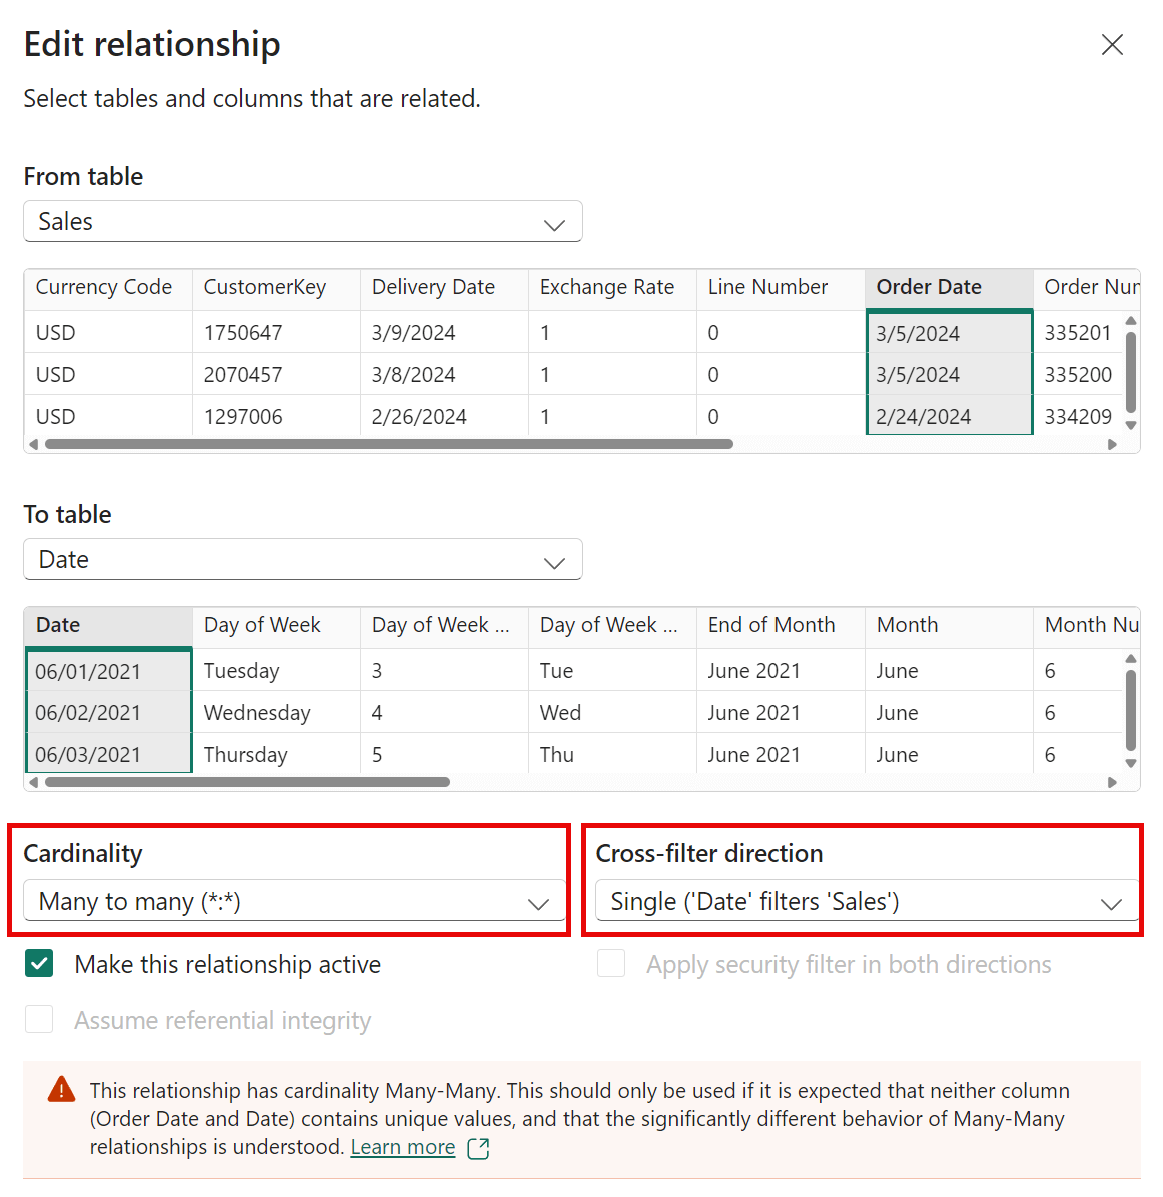
We obtain the following model by applying these properties to both relationships between Date and Sales.
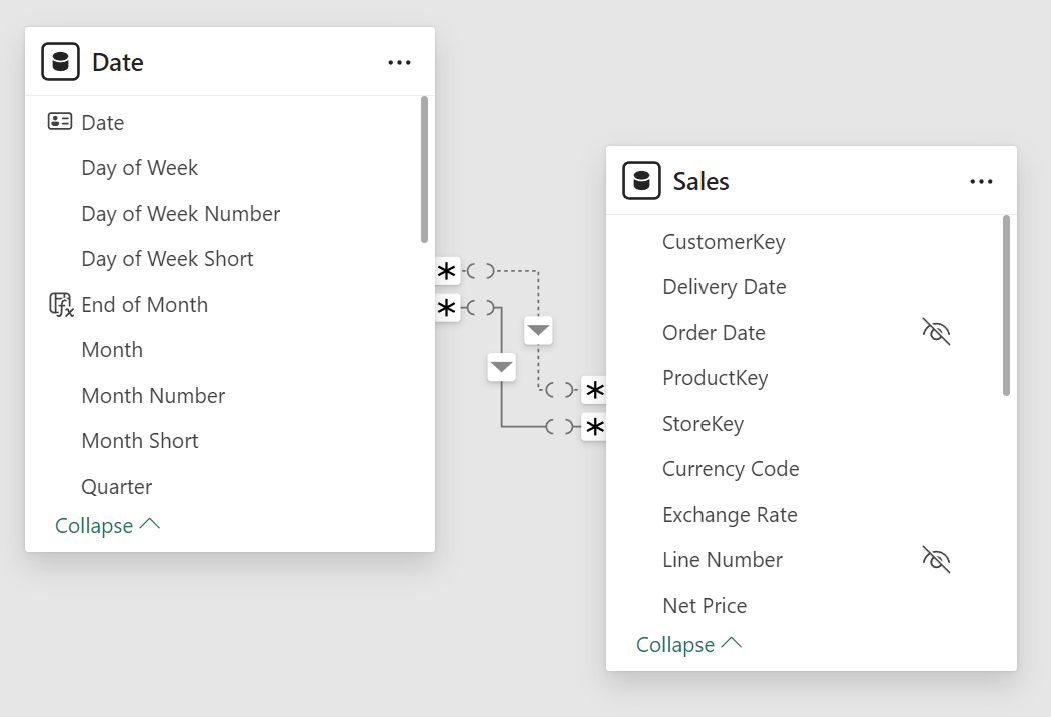
By using these limited relationships, none of the slicers display any blank because of the blank row, regardless of the selection of any filter on the Date table in any part of the report. However, the total amount of Delivered Sales is identical to Sales Amount (7,305,938.94) and does not match the sum of Delivered Sales by year (7,291,306.01 in the report we showed earlier).
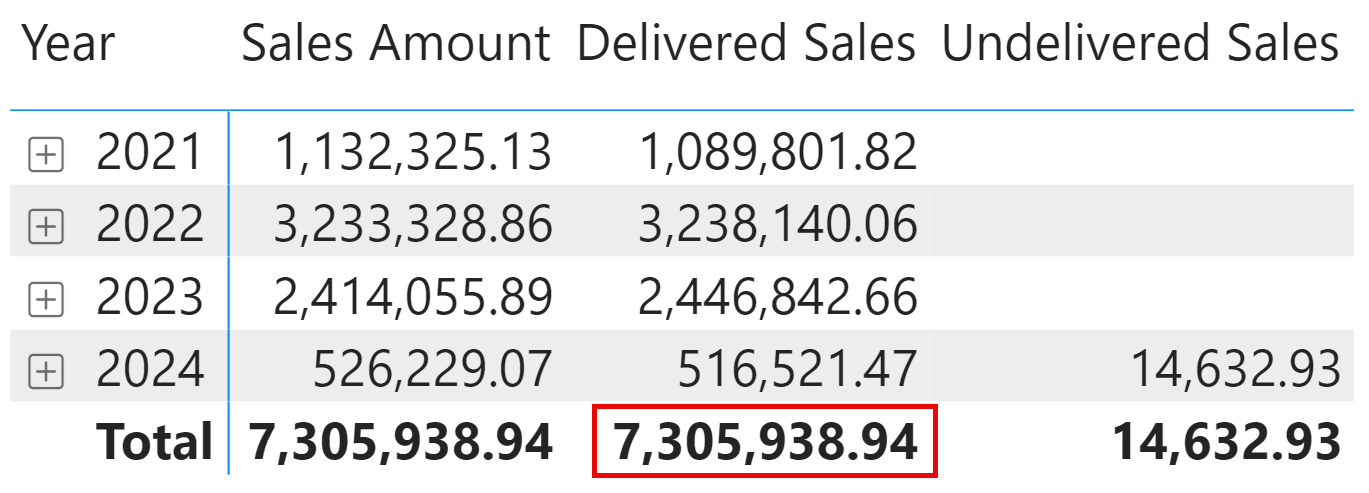
This behavior is what we expect from a limited relationship: when there is no filter on Date (as is the case for the Total row), then all the values of Sales[Delivery Date] are included. This is despite the USERELATIONSHIP applied by the Delivered Sales measure, because there are no filters propagated to Sales. Previously, an “is not blank” filter in the report was propagated from Date to Sales, removing the undelivered sales from the total. If we want to restore a “predictable” behavior for Delivered Sales, we can change its definition to Delivered Sales (fix) by adding a filter on Sales[Delivery Date]:
Delivered Sales (fix) =
CALCULATE (
    [Sales Amount],
    USERELATIONSHIP ( Sales[Delivery Date], 'Date'[Date] ),
    KEEPFILTERS ( NOT ISBLANK ( Sales[Delivery Date] ) )
)
With this measure, we can obtain the expected result by using the many-to-many cardinality relationship.

However, using the many-to-many cardinality relationships to achieve this result is strongly discouraged because of the following reasons:
- Need a measure to filter out the blank values from the total, as we did in Delivered Sales (fix).
- Performance degradation because of the non-additivity behavior of limited relationships – this could be particularly bad when combined with time intelligence calculations.
- Lack of validation of the data in Sales: any date missing in the Date table will be hidden and shown only in the Total row. In other words, you are going to hide potentially dangerous data quality problems.
Blank dates in DAX expressions
When a blank date is present in the Date table, that date corresponds to 0 for numeric columns such as Year and Month Number, and to a date before 1900 for a date column. Therefore, you must pay attention when comparing any column from the Date table using operators like <, <=, >=, or >. You must try to ignore any blank value from the column itself.
For example, consider the Cumulated Delivery measure:
Cumulated Delivery =
VAR LastDateVisible = MAX ( 'Date'[Date] )
RETURN
    CALCULATE (
        [Delivered Sales],
        'Date'[Date] <= LastDateVisible
    )
The measure should show the total amount of delivered sales from the first delivered transaction available. Therefore, the value for 2021 should be identical to Delivered Sales, whereas the value for 2022 should aggregate both 2021 and 2022. However, the value is incorrect from the start, as it shows a larger number already in 2021.

The reason is that the amount not delivered has a blank date: the result of the ‘Date'[Date] <= LastDateVisible predicate always includes the blank value because it is considered “less than” any other date. The solution requires an additional filter. For example, using the Delivered Sales (fix) measure we described for the many-to-many relationships instead of Delivered Sales would ignore the blank row for this calculation. However, the goal of the article is to make you aware that – when you filter a Date – you should be aware of the possible consequences of a blank row. Therefore, an explicit condition in the predicate is a safer way to obtain the cumulated value, as shown in the Cumulated Delivery (fix) measure:
Cumulated Delivery (fix) =
VAR LastDateVisible = MAX ( 'Date'[Date] )
RETURN
    CALCULATE (
        [Delivered Sales],
        NOT ISBLANK ( 'Date'[Date] )
            && 'Date'[Date] <= LastDateVisible
    )
The report shows that the value of Cumulated Delivery (fix) now matches Delivered Sales for 2021, as well as the Total row.

The general rule is that you should always add a NOT ISBLANK ( <date> ) condition whenever you use a comparison operator with a date. Even though this is strictly necessary for < and <= comparison operators, you might prefer a “better safe than sorry” approach applying this NOT ISBLANK ( <date> ) also to > and >= comparison operators. This way, you can be less worried about future changes in these conditions.
Blank dates in iterators
Whenever you use an iterator over the Date table, keep in mind that the blank row is not included when you write a table reference such as the following Delivery Commissions measure (which is not optimized but is written to demonstrate how iterators work with blank rows):
Delivery Commissions =
SUMX (
    'Date',
    [Delivered Sales]
        * IF ( 'Date'[Working Day], 0.05, 0.09 )
)
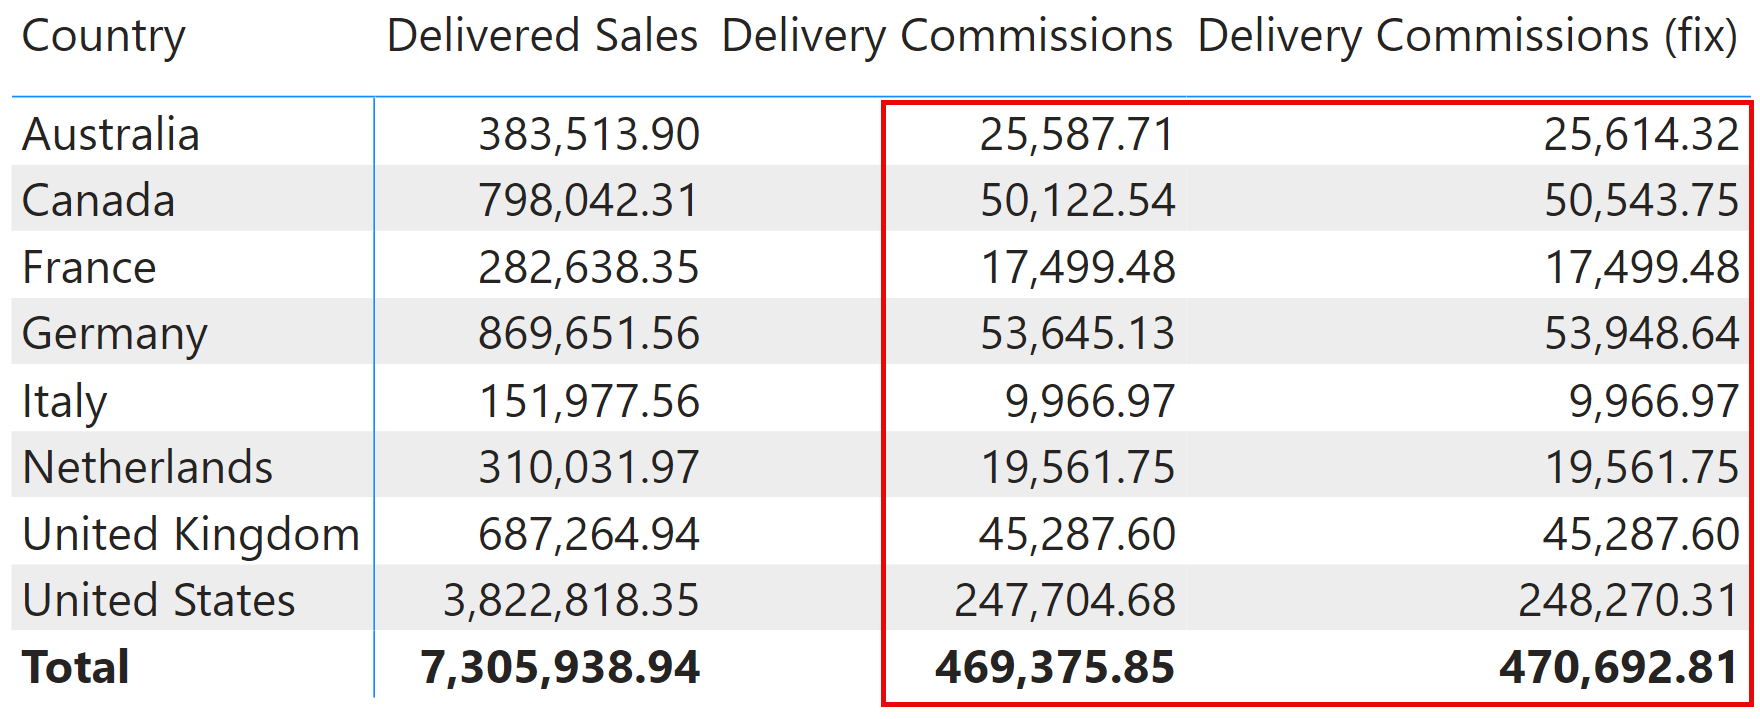
As with any table with a blank row created by an invalid relationship, a simple table reference does not include the additional blank row. Therefore, the amount of Delivered Sales related to orders not delivered is not included in the former version of the measure. The following Delivery Commissions (fix) measure includes the blank row by using VALUES to iterate over the Date table:
Delivery Commissions (fix) =
SUMX (
    VALUES ( 'Date' ),
    [Delivered Sales]
        * IF ( 'Date'[Working Day], 0.05, 0.09 )
)
The resulting report shows a larger amount for Delivery Commissions (fix) than for Delivery Commissions because it includes undelivered sales without requiring a separate calculation.

Keep in mind that this version works because Delivered Sales does not include an explicit exclusion of the undelivered sales – the NOT ISBLANK ( Sales[Delivery Date] ) condition we discussed for other scenarios. However, the goal of this example was to direct your attention to the different options you have when you iterate a table that may have an additional blank row – we used an unrealistic example of a measure to avoid introducing a different use case. While the issue is simple to see when the blank row is visible – as in the previous report, things are more complicated when the date is not involved in the report, but the iterator still uses it. For example, in the following report, it would be hard to say that Delivery Commissions is not correct and Delivery Commissions (fix) has the right number because there is no clear evidence of what is producing the difference between the two measures – evidence that is more clear when the blank row is present in the report.
Meaning of BLANK in DAX time intelligence functions
We want to mention that BLANK has a special meaning in a few DAX time intelligence functions, which should not be confused with the blanks we can observe inside a date column.
In general, the blank row in a Date table is never returned by a DAX time intelligence function. However, the BLANK function can be used as an argument for DATESBETWEEN and DATESINPERIOD.
When the BLANK function is used with DATESBETWEEN, its special meaning is “no boundary”. When used for the StartDate argument, it includes all the dates from the earliest one in the Date table, ignoring the blank row. When used for the EndDate argument, it includes all the dates until the latest one in the Date table. The following example shows all the dates in Date until January 3rd, 2017:
EVALUATE
DATESBETWEEN ( 'Date'[Date], BLANK(), dt"2017-01-03" )
| Date |
|---|
| 2017-01-01 |
| 2017-01-02 |
| 2017-01-03 |
This other example shows all the dates in Date from December 12th, 2020:
EVALUATE
DATESBETWEEN ( 'Date'[Date], dt"2020-12-29", BLANK() )
| Date |
|---|
| 2020-12-29 |
| 2020-12-30 |
| 2020-12-31 |
For DATESINPERIOD, the blank value does not have a special meaning for StartDate: it just corresponds to a date that is before 1900, so it can be used to get the first dates from the beginning of the Date table without knowing when the Date table starts. For example, the following query returns the first three days in the Date table:
EVALUATE
DATESINPERIOD ( 'Date'[Date], BLANK(), 3, DAY )
| Date |
|---|
| 2017-01-01 |
| 2017-01-02 |
| 2017-01-03 |
Conclusion
Handling blank dates in DAX requires careful consideration to ensure accurate and meaningful results. In DAX expressions, remember to exclude blank dates in comparisons to avoid issues associated with missing dates. Remember that blank dates can carry important business meaning: alternative approaches like special dates or other placeholders can have similar negative side effects, so it is better to understand how to manage blanks rather than try to avoid them at all cost.
Returns a table with one column of dates calculated from the model automatically.
CALENDARAUTO ( [<FiscalYearEndMonth>] )
Specifies an existing relationship to be used in the evaluation of a DAX expression. The relationship is defined by naming, as arguments, the two columns that serve as endpoints.
USERELATIONSHIP ( <ColumnName1>, <ColumnName2> )
Checks whether a value is blank, and returns TRUE or FALSE.
ISBLANK ( <Value> )
When a column name is given, returns a single-column table of unique values. When a table name is given, returns a table with the same columns and all the rows of the table (including duplicates) with the additional blank row caused by an invalid relationship if present.
VALUES ( <TableNameOrColumnName> )
Returns a blank.
BLANK ( )
Returns the dates between two given dates.
DATESBETWEEN ( <Dates>, <StartDate>, <EndDate> )
Returns the dates from the given period.
DATESINPERIOD ( <Dates>, <StartDate>, <NumberOfIntervals>, <Interval> [, <EndBehavior>] )
 Marco Russo & Alberto Ferrari