 Marco Russo & Alberto Ferrari
The filter context is a fundamental concept to understand in order to write good DAX code. In this article, we describe the filter context using a visual approach – we rely on a graphical visualization that represents the different interactions that exist in the filter context when you use the visual elements, filters, and slicers of a report. This is the first step to plan the changes required to obtain the desired result: these changes can be obtained by using the CALCULATE function, which removes, adds, and replaces existing filters in the filter context.
This article provides a different perspective on a topic already discussed in other filter context articles: read them to get more insights about this importance concept for DAX.
Each cell has a different filter context
Every number in a report is produced by evaluating a DAX expression in a particular filter context. The same expression produces different results because it is always evaluated in different filter contexts. Therefore, every cell in a matrix and every data point in a chart have a different filter context.
We analyze the filter context by describing the filters applied to one cell in a matrix visual. The following picture describes the filter context for the highlighted cell returning 8,776.54.
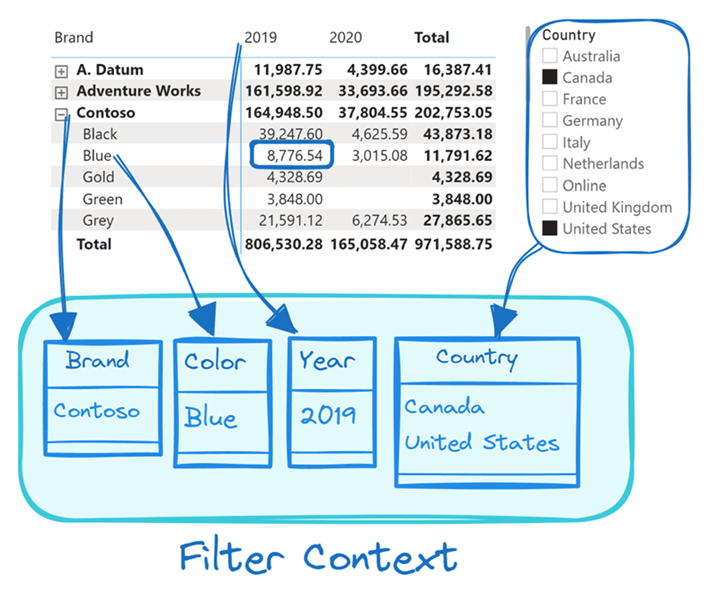
The cell shows the value of Sales Amount in 2019 for Blue Contoso products sold in the United States and Canada. Each filter in the filter context is a table with a list of values “visible” for one or more columns in the semantic model. In this first example, there are four filters, each one filtering one column, with a single value filtered in Brand, Color, and Year; the Country column has a list of two values visible, which corresponds to the selection made in the slicer (Canada and the United States).
All the table functions evaluated in a filter context only return those rows that are “visible” through the filters applied to the filter context. The filter context filters tables in the model in an extremely efficient way. Moreover, the filter is “consumed” only when an aggregation or an iterator is evaluated. Later, we will see that with CALCULATE we can manipulate the filter context before executing an expensive aggregation, with benefits in both flexibility and performance.
A filter is a table
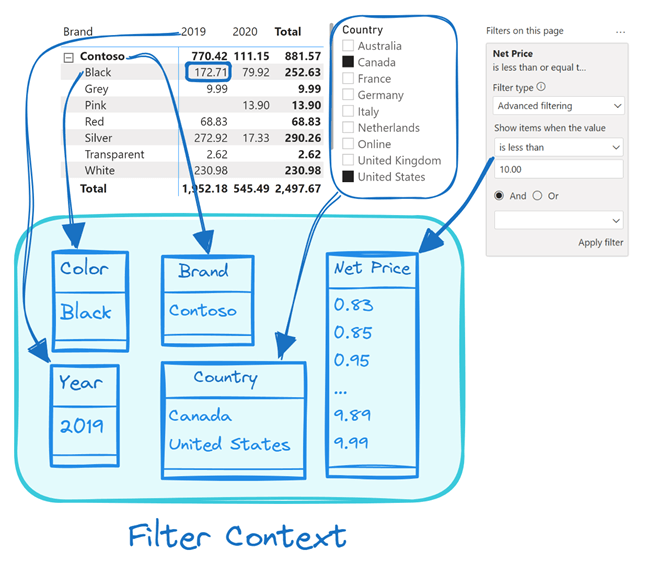
The first important concept is that a filter in the filter context is a table with a list of values for one or more columns. In the previous example, the slicer has two countries selected, and those values are listed in the corresponding filter. However, even if the filter is specified with an operator like “less than” for a numeric column, the filter is always represented with the list of existing values for that column satisfying the filter condition. For example, if the filter pane in a report has a condition that says Net Price less than 10.00, the corresponding filter includes the list of unique values in the column satisfying that condition. The number of values in the filter depends on the unique values existing in the column.
We know that a more intuitive way to represent the filter context is to write the filter condition that defined the filter. In the previous picture, we could be tempted to write “< 10.00” instead of the list of unique values satisfying that condition for Net Price. That would have worked, but only up to a certain point. Indeed, with more complex filters it is impossible to describe the result without using this representation. If you want to investigate that, look at the “Complex filters” query in the sample file by using the DAX Query View in Power BI Desktop – however, this demonstration is not a goal of this article.
Obtaining the target filter context
When you write a calculation, you can often display – in the same visual or in a different visual – all the numbers involved in a calculation. Each number in the report is the result of a measure executed in a specific filter context. Whenever we need that number, we just have to evaluate that measure in that filter context. Thus, before writing a DAX formula, it is a good idea to describe the filter context of each term involved in the calculation.
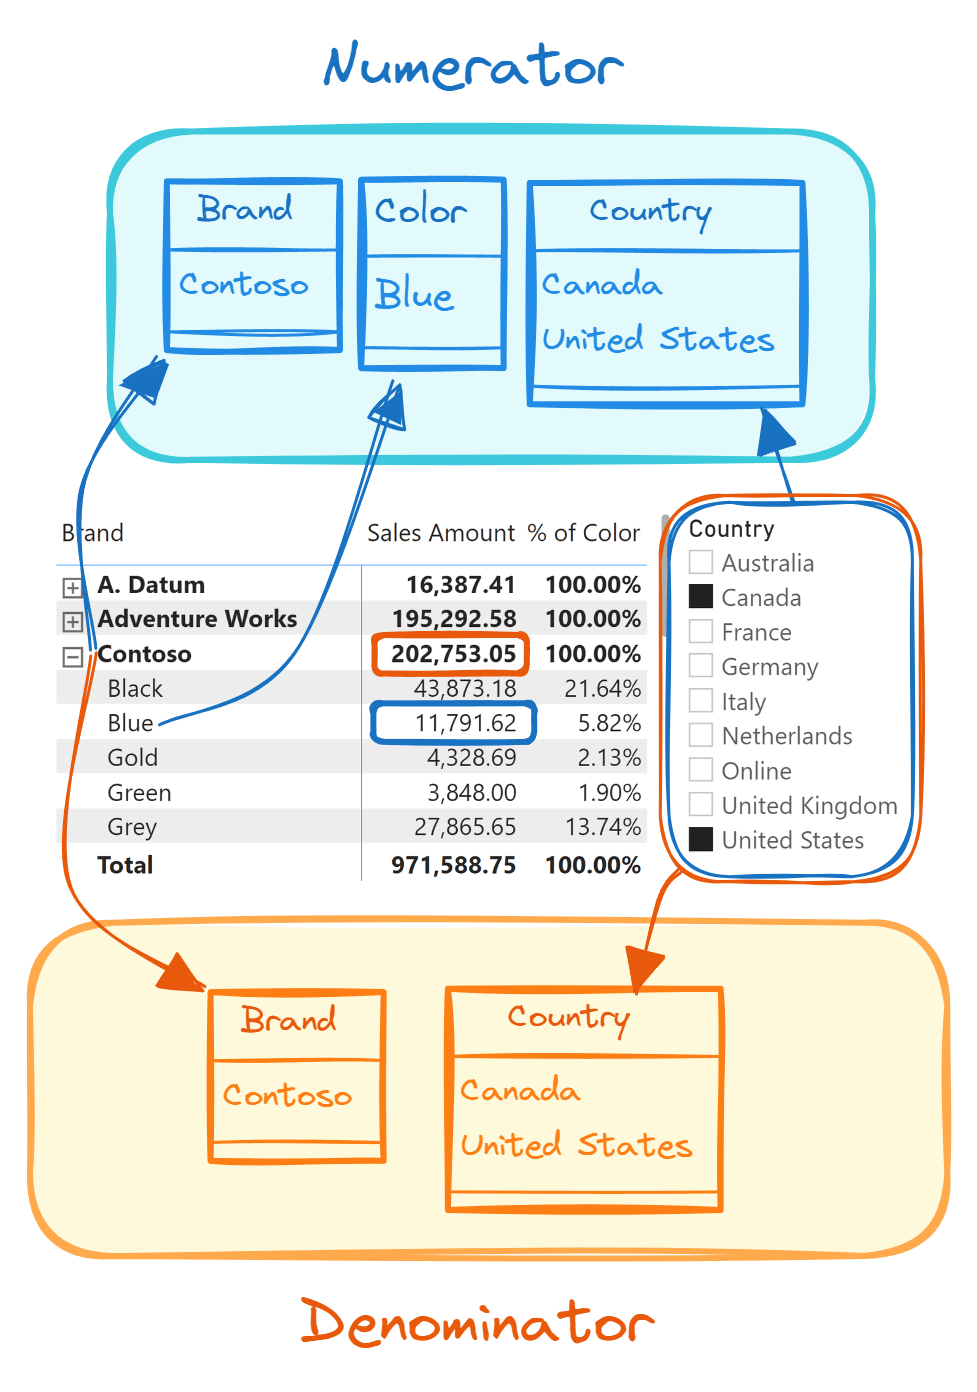
For example, consider the requirement of a % of Color measure returning the percentage of Sales Amount for each color. The following report shows the percentage of each color in the Contoso brand filtering only two countries, Canada and the United States. Before writing any DAX code, we can describe in English the calculation as the division between the Sales Amount of a color (11,791.62 for Blue products within the Contoso brand) and Sales Amount for all the colors (202,753.05 for all the product colors within the Contoso brand). In the following picture we highlighted the numerator and the denominator of this division, describing the filter context for each term.
We can write the % of Color measure as a division between two measures, Sales Amount and Sales All Colors:
% of Color =
DIVIDE (
    [Sales Amount],
    [Sales All Colors]
)
The existing Sales Amount measure in the current filter context provides the value for the numerator of the division. The Sales All Colors measure must evaluate Sales Amount in the target filter context.
Removing a filter
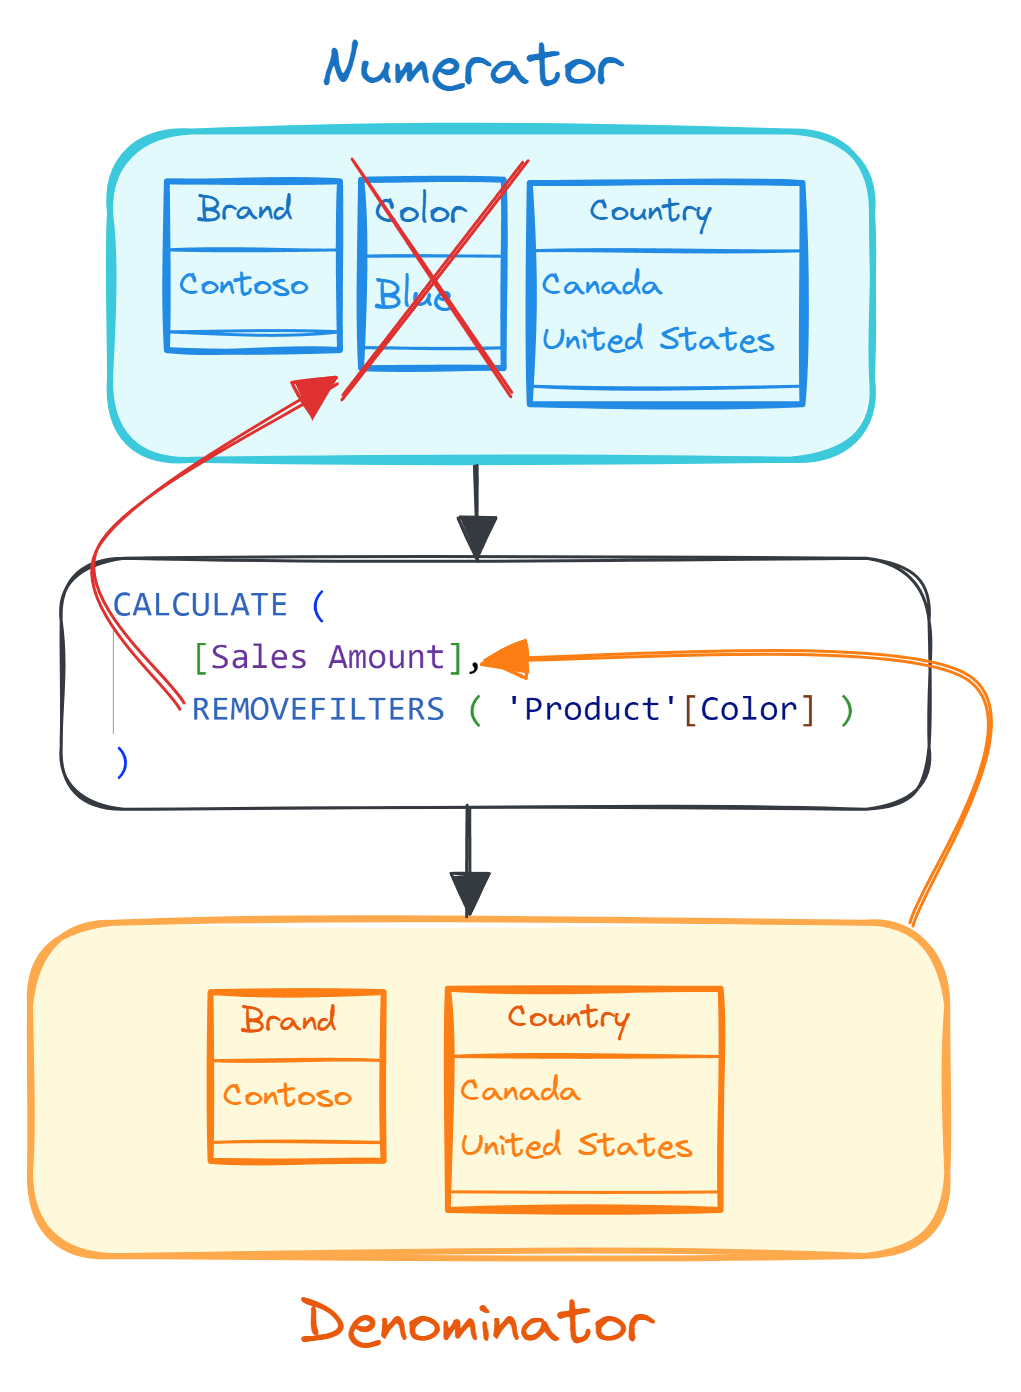
By comparing the two filter contexts, we can change the initial filter context (Numerator) to obtain the target filter context (Denominator) to then compute the measure required. For example, the % of Color measure has an initial filter context that corresponds to the numerator of the division. This filter context has three filters: Blue color, Contoso brand, Canada and United States. The target filter context has only two filters that are not different from the initial filter context (Brand and Country). The only difference between them is the Color filter, which is not present in the target filter context.
We can obtain the target filter context for Sales All Colors by removing the Color filter from the initial filter context. By using CALCULATE, the initial filter context (Numerator) is temporarily duplicated, then REMOVEFILTERS removes the filter from Product[Color], and finally the Sales Amount measure is evaluated in the modified filter context (Denominator).
This is the definition of Sales All Colors:
Sales All Colors =
CALCULATE (
    [Sales Amount],
    REMOVEFILTERS ( 'Product'[Color] )
)
It is also possible to use ALL instead of REMOVEFILTERS – their behavior in CALCULATE is identical, but we prefer to use REMOVEFILTERS as it better describes the semantics of the action performed in the filter context: a filter is removed and not replaced with a list of all the values existing in the column.
Adding a filter
We have seen how to remove a filter to obtain the target filter context. There are other cases where we must add a filter that does not exist in the initial filter context. Remember, adding a filter usually reduces the number of rows that will be aggregated, thus producing a smaller number when we sum values. This may be counterintuitive in the beginning, because we “add” a filter to “reduce” the result!
For example, consider the requirement of comparing Sales Amount for each product color with corresponding sales of the Contoso products in the Sales Contoso measure we must implement. The initial filter context for Sales Amount has only one filter for Color. We just add a filter on Product[Brand] by writing a filter condition in CALCULATE for Sales Contoso:
Sales Contoso =
CALCULATE (
    [Sales Amount],
    'Product'[Brand] = "Contoso"
)
Although the filter condition is an expression, what we get in the target filter context is a table with the list of values filtered on Brand, which is only Contoso for this example.

As long as the filter applied to the filter context describes conditions for columns that were not directly filtered by the filter context, a filter condition simply adds a filter. However, if a filter already exists, then we should pay attention to the potential removal of existing filters.
Replacing a filter
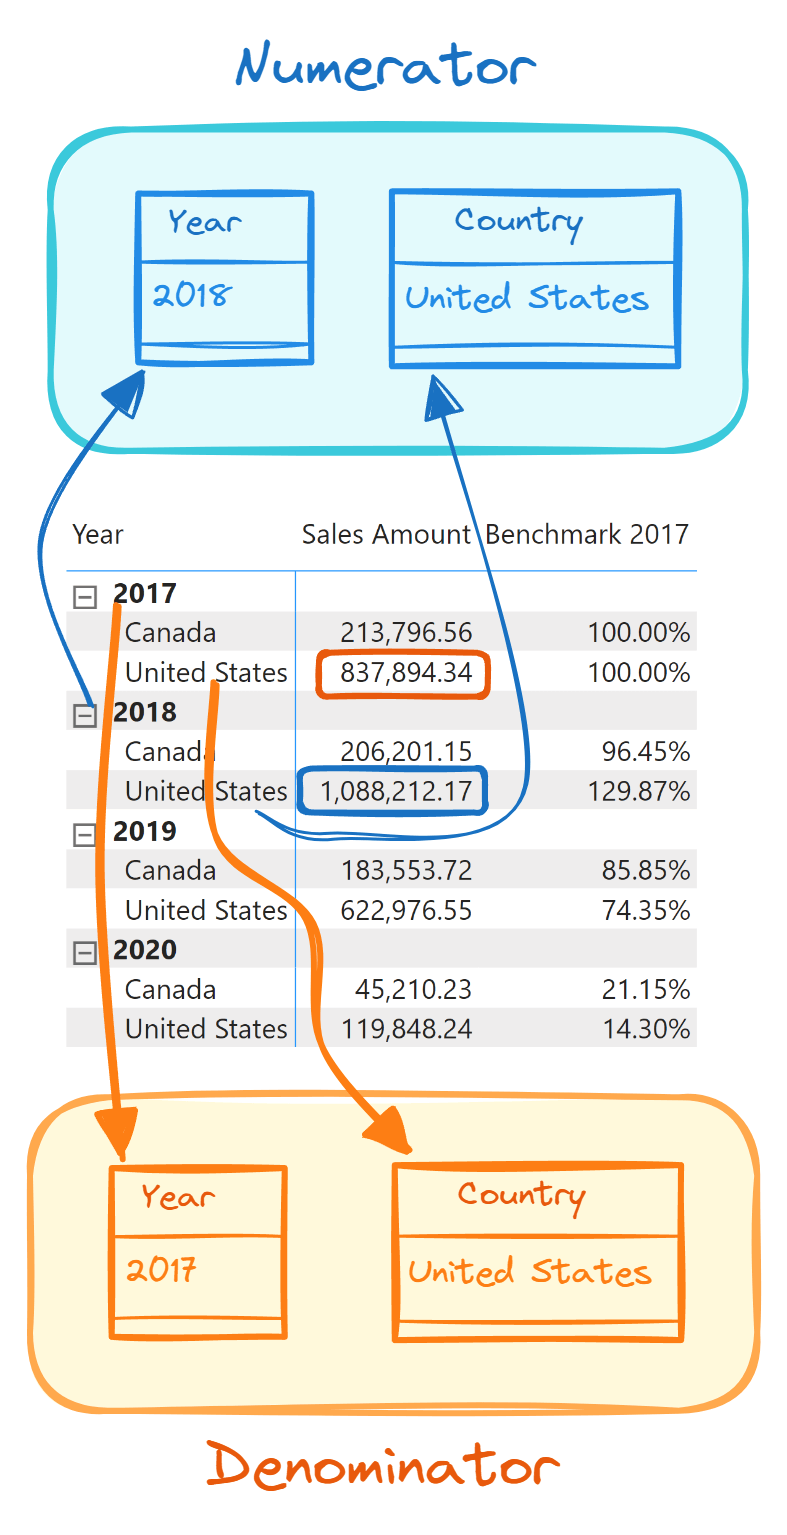
A different scenario is that of replacing an existing filter in the filter context with a different filter. For example, in the following report we want to compare the sales of each country over several years using 2017 as a benchmark. The Benchmark 2017 measure divides the Sales Amount of a year by Sales 2017, the sales amount for 2017. Similarly to what we have seen in a previous example, we can write the Benchmark 2017 measure as a division between two measures:
Benchmark 2017 =
DIVIDE (
    [Sales Amount],
    [Sales 2017]
)
When we compare the initial filter context (Numerator) with the target (Denominator), we realize that we should replace the existing filter on Year with 2017.
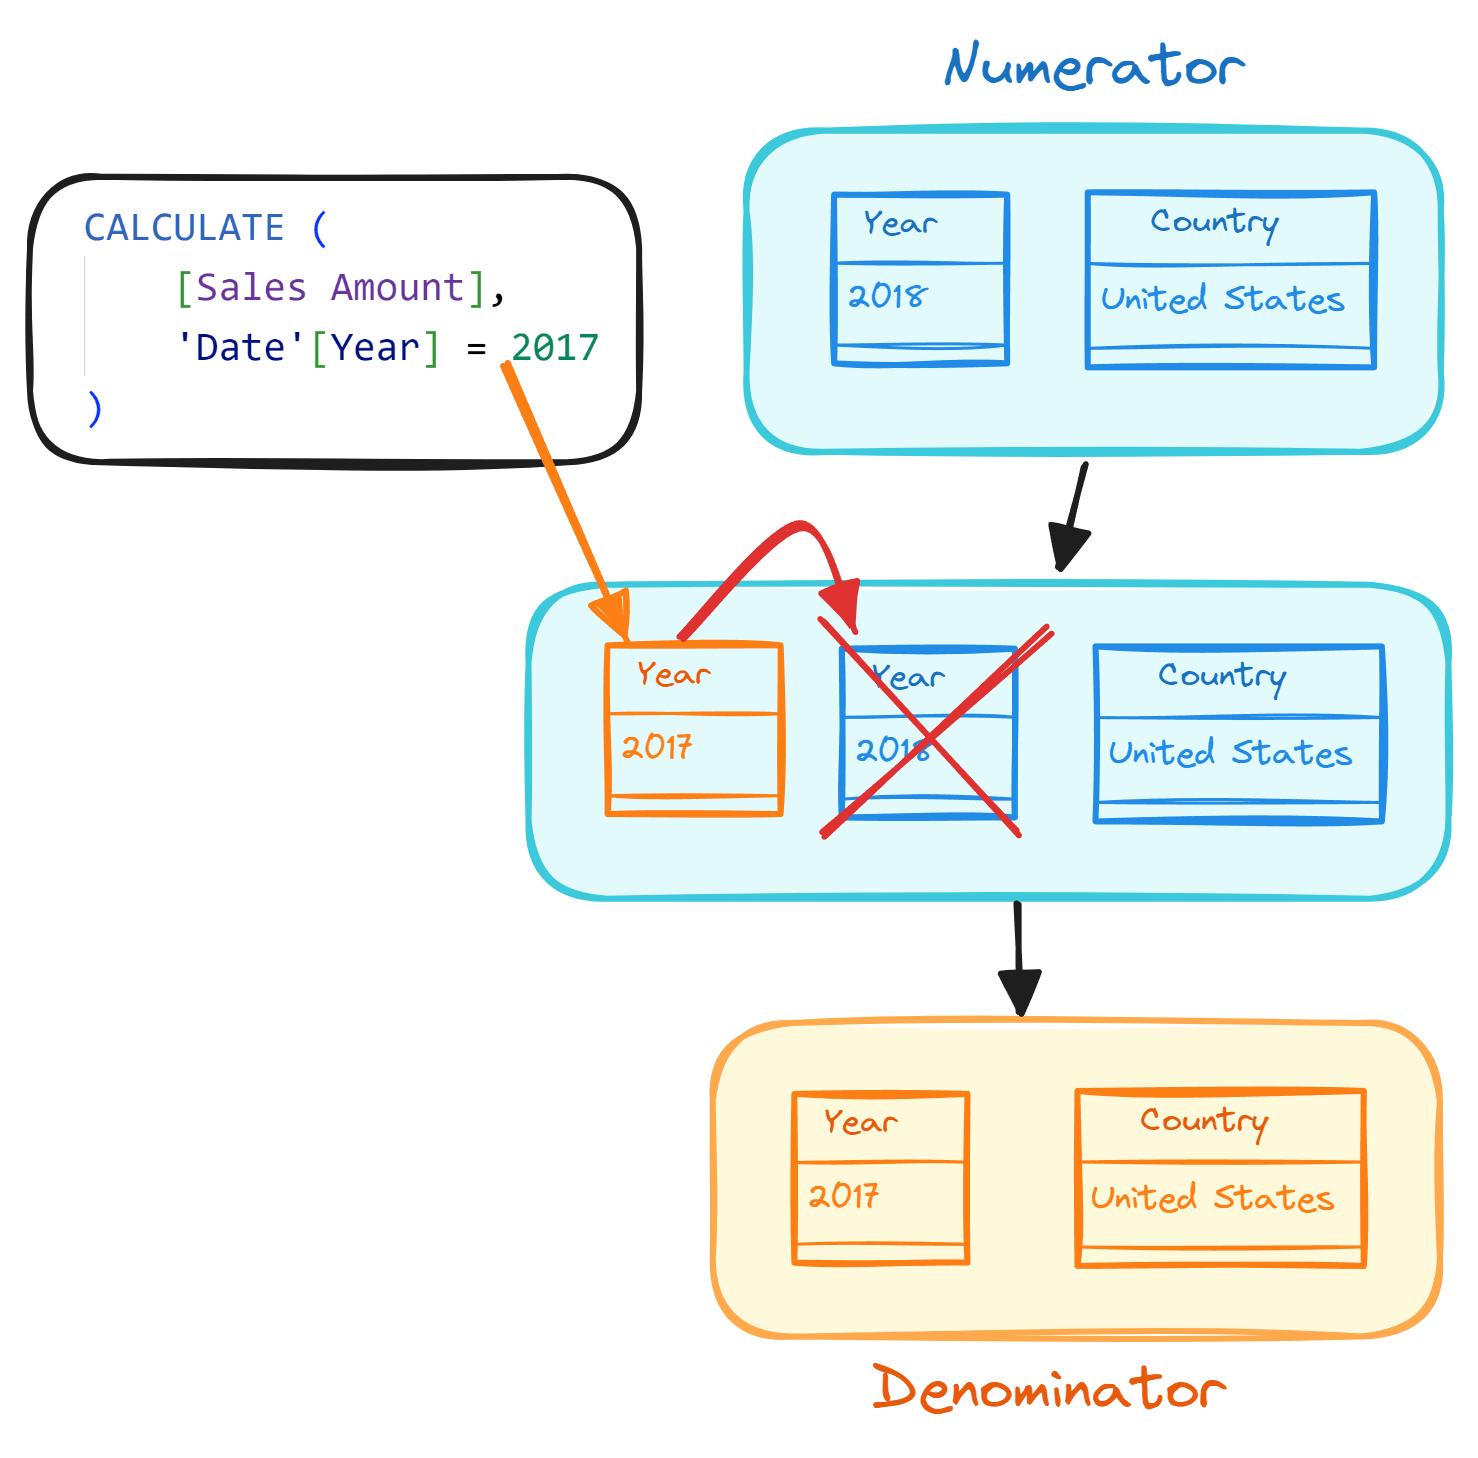
The CALCULATE syntax is surprisingly similar to the syntax we saw in the previous example when we added a filter to the filter context:
Sales 2017 =
CALCULATE (
    [Sales Amount],
    'Date'[Year] = 2017
)
Indeed, the filter argument in CALCULATE adds the filter on Year (2017) to the initial filter context. However, the existing filter on Year (for example, 2018) is removed, because every filter added to the filter context automatically removes any existing filters on the columns involved by the new filter.
From a DAX standpoint, it is like saying that every time you add a filter to the filter context, a REMOVEFILTERS on the same columns is automatically added to the same CALCULATE. So we get the same result as if we wrote the following code:
Sales 2017 =
CALCULATE (
    [Sales Amount],
    'Date'[Year] = 2017,
    REMOVEFILTERS ( 'Date'[Year] )
)
Combining a new filter with existing filters
The automatic removal of an existing filter was helpful in the previous example, but we might want to change this behavior when we have different requirements. For example, suppose we must create a Large Transactions measure returning the Sales Amount for those transactions where the amount is greater than 1,000. This filter condition must filter the result of the multiplication of two Sales columns (Quantity and Net Price), producing a filter that has two columns and not only one. However, if the report already has a filter on either Quantity or Net Price, we do not want to remove it in our calculation.
The solution requires to wrap the filter condition inside a KEEPFILTERS:
Large Transactions =
CALCULATE (
    [Sales Amount],
    KEEPFILTERS (
        Sales[Quantity] * Sales[Net Price] > 1000
    )
)
We can see how this calculation works step by step, with an illustration of the changes applied to the filter context.
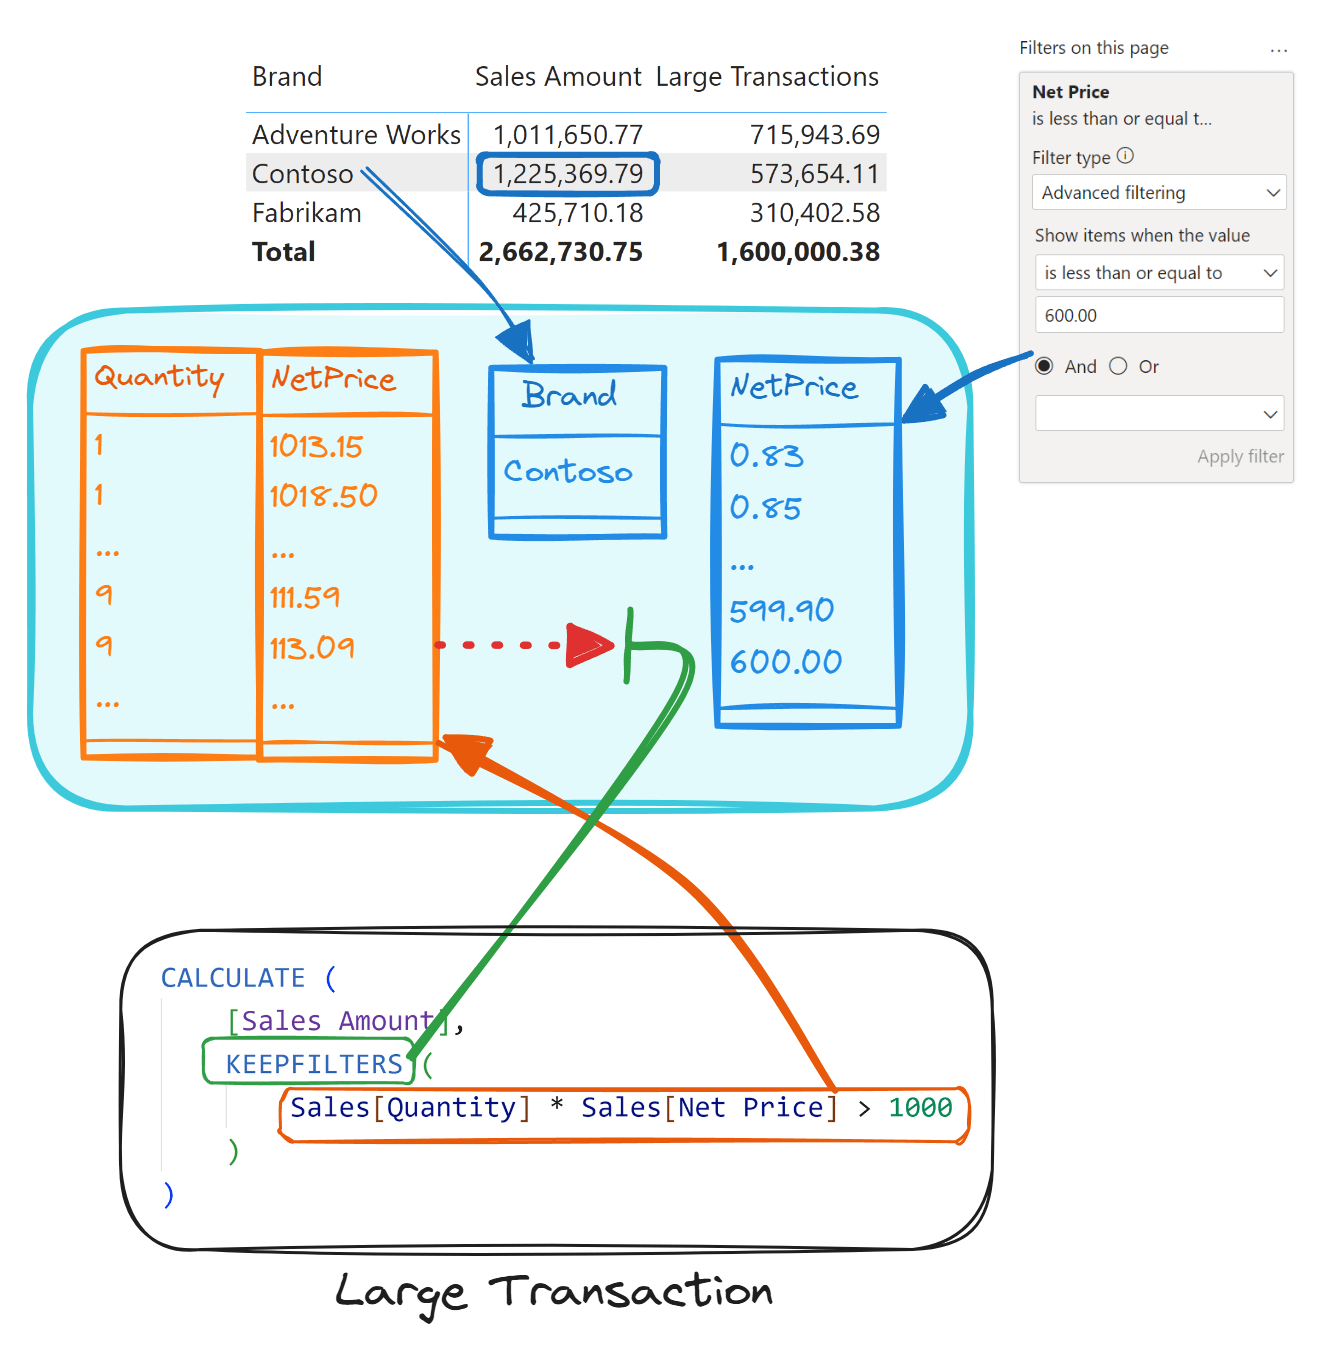
The initial filter context for the Sales Amount of Contoso products has only two filters: Brand (Contoso) and Net Price. The Sales[Quantity] * Sales[Net Price] > 1000 condition in CALCULATE adds a filter with two columns, to the filter context (Quantity and Net Price). The presence of KEEPFILTERS prevents the removal of the existing filter on Net Price, which would otherwise be removed by the new filter. If you need more information about the use of KEEPFILTERS, you should study the best practices from a previous article.
Conclusions
Using a graphical representation of the filter context is helpful for both planning the implementation of a calculation using CALCULATE, and describing the behavior of existing calculations. While the engine might use optimizations to avoid the actual materialization of each filter, this way of representing the filters in the filter context can explain every corner case of filter context manipulation.
You can remove, add, and replace filters in the filter context by using CALCULATE. The goal of this article is to provide another perspective on the filter context without replacing the existing material we have in other articles, books, and video courses. Moreover, there is no better way to learn than to practice on your own data. If you are a visual learner, we hope that this article will be helpful, as it gives you an additional point of view to represent the abstract concepts behind the evaluation context in DAX.
Evaluates an expression in a context modified by filters.
CALCULATE ( <Expression> [, <Filter> [, <Filter> [, … ] ] ] )
Clear filters from the specified tables or columns.
REMOVEFILTERS ( [<TableNameOrColumnName>] [, <ColumnName> [, <ColumnName> [, … ] ] ] )
Returns all the rows in a table, or all the values in a column, ignoring any filters that might have been applied.
ALL ( [<TableNameOrColumnName>] [, <ColumnName> [, <ColumnName> [, … ] ] ] )
Changes the CALCULATE and CALCULATETABLE function filtering semantics.
KEEPFILTERS ( <Expression> )