This blog post is not an easy one, so let me start with some conclusions, in order to let you understand why you need to read the post up to the end and digest its content.
- Is a new feature in the Denali version of DAX
- Is very useful, I would say necessary
- It solves a problem that is very common and very difficult to address
- It is complex. No, is is very complex. I think Rob will need to update his spicy scale of functions to make some place for KEEPFILTERS
- If you don’t use and understand it, you will incur in major problems with your formulas and debugging the wrong results will turn into a nightmare
These are the final considerations. Now, if you want to discover why these facts holds, roll up your sleeves and come with me in a travel in the land of filter contexts.
We all know that filter contexts are the foundation of any DAX calculation. The CALCULATE function is used to create, alter, update filter contexts and to create any complex formula in DAX. We also know that iterators like FILTER, SUMX and AVERAGEX create a row context that gets translated into a filter context when a measure is used as the formula to iterate.
For example, to compute the average of yearly sales, we can define a couple of measures:
TotalSales := SUM (FactInternetSales[SalesAmount])
AvgYear := AVERAGEX (VALUES (DimTime[CalendarYear]), [TotalSales])
The measure [TotalSales] inside AVERAGEX is called in a filter context that filters only one year. The values are then averaged to return the correct value. All this is well known.
For educational purposes, we are not going to use AVERAGEX but a modified version of the formula which is useless, but makes the concepts clearer. We simply substitute AVERAGEX with SUMX:
TotalSales := SUM (FactInternetSales[SalesAmount])
SumYear := SUMX (VALUES (DimTime[CalendarYear]), [TotalSales])
Thus, SumYear is equivalent to SUM (FactInternetSales[SalesAmount]). Or… it should be… as we are going to see in a few minutes, something weird will happen when we evaluate this formula over a user defined hierarchy.
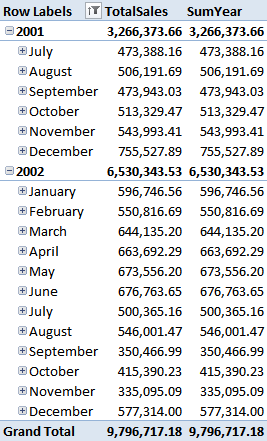
In the following figure, I have put the calendar hierarchy on the rows, TotalSales and SumYear on the columns and the result is straightforward: the two results are identical.

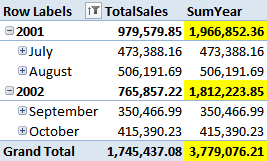
Now, I can filter the time and decide that I want to see only July and August for 2001 and September and October for 2002. This can be easily accomplished filtering the hierarchy but, this time, the result is much more interesting:
If you look at the highlighted cells you should have the strong feeling that something is going wrong. From where do these strange numbers come? At the month level, everything is fine. At the year level and at the grand total the values shown make no sense at all. In order to understand what is going wrong here, we need, as always, to dive into the different filter contexts that exists during the steps of the computation.
First of all, we have filtered some months for 2001 and some other months for 2002, creating a complex filter that looks like this:
   (DimTime[CalendarYear] = 2001 && (DimTime[MonthName] = "July" || DimTime[MonthName] = "August"))
|| (DimTime[CalendarYear] = 2002 && (DimTime[MonthName] = "September" || DimTime[MonthName] = "October"))
This filter contains two columns: MonthName and CalendarYear and the resulting filter is a mix of both columns, resulting in a relationship between the two columns. Please, read this sentence twice and keep this in mind: this filter contains two columns.
Now, what happens when the SumYear gets evaluated? This is the formula:
SumYear := SUMX (VALUES (DimTime[CalendarYear]), [TotalSales])
SUMX iterates over the values of CalendarYear and, for each value, it computes TotalSales, after having transformed the row context over CalendarYear in a filter context. Thus, if we unroll the iteration, the formula is equivalent to:
CALCULATE ([TotalSales], DimTime[CalendarYear] = 2001) +
CALCULATE ([TotalSales], DimTime[CalendarYear] = 2002)
We have two CALCULATE that set a filter on the year. Now it is useful to remember that when a column gets filtered inside CALCULATE, the new filter overrides any existing filter on the same column. Do we have any filter on CalendarYear? Yes, we do, because the previous filter context imposed by the hierarchy was filtering CalendarYear and MonthName. Thus, the engine will remove the filter on CalendarYear from that formula and then apply the new filter.
What happens to our original filter if we remove all the references to CalendarYear? It becomes:
   ((DimTime[MonthName] = "July" || DimTime[MonthName] = "August"))
|| ((DimTime[MonthName] = "September" || DimTime[MonthName] = "October"))
You see that removing CalendarYear from the filter it now become a completely different filter, that says: “any month from July to October is fine”. We are then going to add the new filter on CalendarYear and the resulting filter, under which [TotalSales] gets computed is:
 DimTime[CalendarYear] = 2001
     && (DimTime[MonthName] = "July" ||
         DimTime[MonthName] = "August" ||
         DimTime[MonthName] = "September" ||
         DimTime[MonthName] = "October")
In other words, the cell for the year 2001 takes into account the months from July to October and, clearly, the same happens fro 2002. The final result is completely wrong because the original filter is lost. This is the reason for which numbers are wrong.
Luckily, the SSAS dev team addressed this problem in advance and gave us the magic function KEEPFILTERS. What KEEPFILTERS does is to modify the semantics of CALCULATE so that the new filter will not replace any existing filter but will be merged in AND with any previous filters.
If we rewrite our SumYear definition in this way:
SumYearWithKeepFilters := SUMX (
    KEEPFILTERS (VALUES (DimTime[CalendarYear])),
    [TotalSales])
We are asking DAX to take the values of DimTime[CalendarYear] but keep any existing filter on the same column in place, without removing them. With this definition, the filter context under which [TotalSales] gets evaluated is:
    DimTime[CalendarYear] = 2001 &&
   (DimTime[CalendarYear] = 2001 && (DimTime[MonthName] = "July" || DimTime[MonthName] = "August"))
|| (DimTime[CalendarYear] = 2002 && (DimTime[MonthName] = "September" || DimTime[MonthName] = "October"))
And, this time, the formula will return the correct result because the original filter context is preserved and, with it, the relationship between months and years. You can see that in the following figure:
Now that we have understood the issue with SUM, it is easy to see that the same problem happens with AVERAGE, but it is harder to detect because numbers are not so easy to check.
Before to go to a conclusion, I would like to spend some more words on the topic and I will use DAX EVALUATE function to show how the same scenario can easily happen (and be verified) in DAX. The same model, deployed on SSAS Server in Vertipaq mode, can be queried with DAX and, to simulate the complex condition, we use CALCULATETABLE and put a filter on a CROSSJOIN. Take a look at this DAX query:
DEFINE
    MEASURE FactInternetSales[SumYearNoKeep] = SUMX (VALUES (DimTime[CalendarYear]), [TotalSales])
    MEASURE FactInternetSales[SumYearKeep] = SUMX (KEEPFILTERS (VALUES (DimTime[CalendarYear])), [TotalSales])
EVALUATE
    CALCULATETABLE (
        SUMMARIZE (
            CROSSJOIN (
                VALUES (DimTime[CalendarYear]),
                VALUES (DimTime[MonthName])
            ),
            ROLLUP (
                DimTime[CalendarYear],
                DimTime[MonthName]
            ),
            "SumYeaNoKeep", [SumYearNoKeep],
            "SumYeaKeep", [SumYearKeep]
        ),
        FILTER (
            CROSSJOIN (
                VALUES (DimTime[CalendarYear]),
                VALUES (DimTime[MonthName])
            ),
            (DimTime[CalendarYear] = 2001 && (DimTime[MonthName] = "July" || DimTime[MonthName] = "August"))
         || (DimTime[CalendarYear] = 2002 && (DimTime[MonthName] = "September" || DimTime[MonthName] = "October"))
        )
    )
This query returns both [SumYearNoKeep] and [SumYearKeep] and, strangely, they return the same wrong value. This is because the damage of destroying the original filter context has already been done by the CROSSJOIN inside SUMMARIZE, which did not take into account the previous filters.
If we add KEEPFILTERS to the CROSSJOIN inside SUMMARIZE, the formula will be different:
DEFINE
    MEASURE FactInternetSales[SumYearNoKeep] = SUMX (VALUES (DimTime[CalendarYear]), [TotalSales])
    MEASURE FactInternetSales[SumYearKeep] = SUMX (KEEPFILTERS (VALUES (DimTime[CalendarYear])), [TotalSales])
EVALUATE
    CALCULATETABLE (
        SUMMARIZE (
            KEEPFILTERS (
                CROSSJOIN (
                    VALUES (DimTime[CalendarYear]),
                    VALUES (DimTime[MonthName])
                )
            ),
            ROLLUP (
                DimTime[CalendarYear],
                DimTime[MonthName]
            ),
            "SumYeaNoKeep", [SumYearNoKeep],
            "SumYeaKeep", [SumYearKeep]
        ),
        FILTER (
            CROSSJOIN (
                VALUES (DimTime[CalendarYear]),
                VALUES (DimTime[MonthName])
            ),
            (DimTime[CalendarYear] = 2001 && (DimTime[MonthName] = "July" || DimTime[MonthName] = "August"))
         || (DimTime[CalendarYear] = 2002 && (DimTime[MonthName] = "September" || DimTime[MonthName] = "October"))
        )
    )
And, this time, the result will be the correct one. Take your time to understand well these two formulas, they are not easy ones but, hopefully, they will let you understand how KEEPFILTERS works and why it is needed.
Moreover, for the brave reader that has still wants to go deeper into the topic, it is worth to study this variation of the same query, where I have removed the FILTER on the CROSSJOIN and replaced it with a classical FILTER on the full table.
DEFINE
    MEASURE FactInternetSales[SumYearNoKeep] = SUMX (VALUES (DimTime[CalendarYear]), [TotalSales])
    MEASURE FactInternetSales[SumYearKeep] = SUMX (KEEPFILTERS (VALUES (DimTime[CalendarYear])), [TotalSales])
EVALUATE
    CALCULATETABLE (
        SUMMARIZE (
            CROSSJOIN (
                VALUES (DimTime[CalendarYear]),
                VALUES (DimTime[MonthName])
            ),
            ROLLUP (
                DimTime[CalendarYear],
                DimTime[MonthName]
            ),
            "SumYeaNoKeep", [SumYearNoKeep],
            "SumYeaKeep", [SumYearKeep]
        ),
        FILTER (
            DimTime,
            (DimTime[CalendarYear] = 2001 && (DimTime[MonthName] = "July" || DimTime[MonthName] = "August"))
         || (DimTime[CalendarYear] = 2002 &&(DimTime[MonthName] = "September" || DimTime[MonthName] = "October"))
        )
    )
This time the filter is not on the CROSSJOIN of the columns but on the full table, resulting in a table filter context. This formula will return the correct value for both [SumYearNoKeep] and [SumYearKeep] because the table filter context will impose its filter on the individual rows of the table and the new filter on CalendarYear will not touch the filter on the table. As always, in DAX there is a strong difference between a table filter context and a column one. In Denali we can now create a new kind of filter context that contains many columns from the same table and, for that kind of filter context, KEEPFILTER might be necessary to use to avoid inconsistent results in your formulas.
Moreover, even if it seems that KEEPFILTERS usage can be avoided by means of using table filters, keep in mind that we have provided this example using only one table. If you want to filter a CROSSJOIN that uses more than one table, then it will not be easy to create table filter contexts on that structure. Thus, KEEPFILTERS usage is much more convenient because it solves any scenario you will encounter.
Changes the CALCULATE and CALCULATETABLE function filtering semantics.
KEEPFILTERS ( <Expression> )
Evaluates an expression in a context modified by filters.
CALCULATE ( <Expression> [, <Filter> [, <Filter> [, … ] ] ] )
Returns a table that has been filtered.
FILTER ( <Table>, <FilterExpression> )
Returns the sum of an expression evaluated for each row in a table.
SUMX ( <Table>, <Expression> )
Calculates the average (arithmetic mean) of a set of expressions evaluated over a table.
AVERAGEX ( <Table>, <Expression> )
Adds all the numbers in a column.
SUM ( <ColumnName> )
Checks whether all arguments are TRUE, and returns TRUE if all arguments are TRUE.
AND ( <Logical1>, <Logical2> )
Returns the average (arithmetic mean) of all the numbers in a column.
AVERAGE ( <ColumnName> )
Evaluates a table expression in a context modified by filters.
CALCULATETABLE ( <Table> [, <Filter> [, <Filter> [, … ] ] ] )
Returns a table that is a crossjoin of the specified tables.
CROSSJOIN ( <Table> [, <Table> [, … ] ] )
Creates a summary of the input table grouped by the specified columns.
SUMMARIZE ( <Table> [, <GroupBy_ColumnName> [, [<Name>] [, [<Expression>] [, <GroupBy_ColumnName> [, [<Name>] [, [<Expression>] [, … ] ] ] ] ] ] ] )
 Alberto Ferrari
