Because the topic of this article is somewhat intricate, it is a good idea to start with basic DAX theory reminders that will be useful later.
In DAX, these two measures are totally equivalent:
RedSalesCompact :=
CALCULATE (
    [SalesAmount],
    Product[Color] = "Red"
)

RedSalesExtended :=
CALCULATE (
    [SalesAmount],
    FILTER ( ALL ( Product[Color] ), Product[Color] = "Red" )
)
Indeed, the compact syntax (also referred to as a Boolean filter) is translated into the extended syntax by the engine as part of the evaluation of an expression. CALCULATE filters are tables. Even though they can be written as Boolean expressions, they are always interpreted as tables.
A common practice in computing percentages is to divide a given measure by the same measure where certain filters are removed. For example, a proper expression for the percentage of sales against all colors would look like this:
PctOverAllColors :=
DIVIDE (
    [SalesAmount],
    CALCULATE (
        [SalesAmount],
        ALL ( Product[Color] )
    )
)
This formula reads as follows:
ALL returns a table containing all the colors; this table represents the valid colors to be used in the new filter context of CALCULATE. Forcing all the colors to be visible is equivalent to removing any and all filters from the Color column.
This description consists of two sentences: both are wrong. This is not to say that the description is completely wrong. It is accurate most of the time, but not always. The correct description of the behavior of ALL in the PctOverColors measure above is much simpler indeed:
ALL removes any active filters from the Color column.
In the correct description there is no statement about the result of ALL – in fact, it does not return anything – and there is no equivalence between a table with all values and the removal of a filter. The reality is much simpler: filters are removed. At first sight, it looks like a very pedantic detail. However, this small difference may yield very different results when used in more complex DAX expressions.
As an example, let us consider these two measures: NumOfProducts computes the total number of products, whereas NumOfProductsSold only counts products which have been sold, by leveraging table filtering.
NumOfProducts :=
DISTINCTCOUNT ( Product[ProductName] )

NumOfProductsSold :=
CALCULATE (
    [NumOfProducts],
    Sales
)
NumOfProducts is straightforward, whereas NumOfProductsSold requires additional DAX knowledge because it is based on table expansion. Because a table is being used as a filter parameter in CALCULATE, the filter context contains all the columns of the expanded version of Sales. If you are not familiar with expanded tables, you will find additional resources in Chapter 10 of the book, The Definitive Guide to DAX.
Consider the query:
DEFINE
    MEASURE Sales[NumOfProducts] =
        DISTINCTCOUNT ( Product[Product Name] )
EVALUATE
ROW (
    "NumOfProducts", [NumOfProducts],
    "NumOfProductsSold", CALCULATE ( [NumOfProducts], Sales )
)
The result is:
- NumOfProducts: 2,517
- NumOfProductsSold: 1,170
In presence of a filter context, both measures restrict their calculation to the current filter context. For example, by adding an outer CALCULATETABLE that filters red products, the query becomes:
DEFINE
    MEASURE Sales[NumOfProducts] =
        DISTINCTCOUNT ( Product[Product Name] )
EVALUATE
CALCULATETABLE (
    ROW (
        "NumOfProducts", [NumOfProducts],
        "NumOfProductsSold", CALCULATE ( [NumOfProducts], Sales )
    ),
    'Product'[Color] = "Red"
)
And the result is:
- NumOfProducts: 99
- NumOfProductsSold: 51
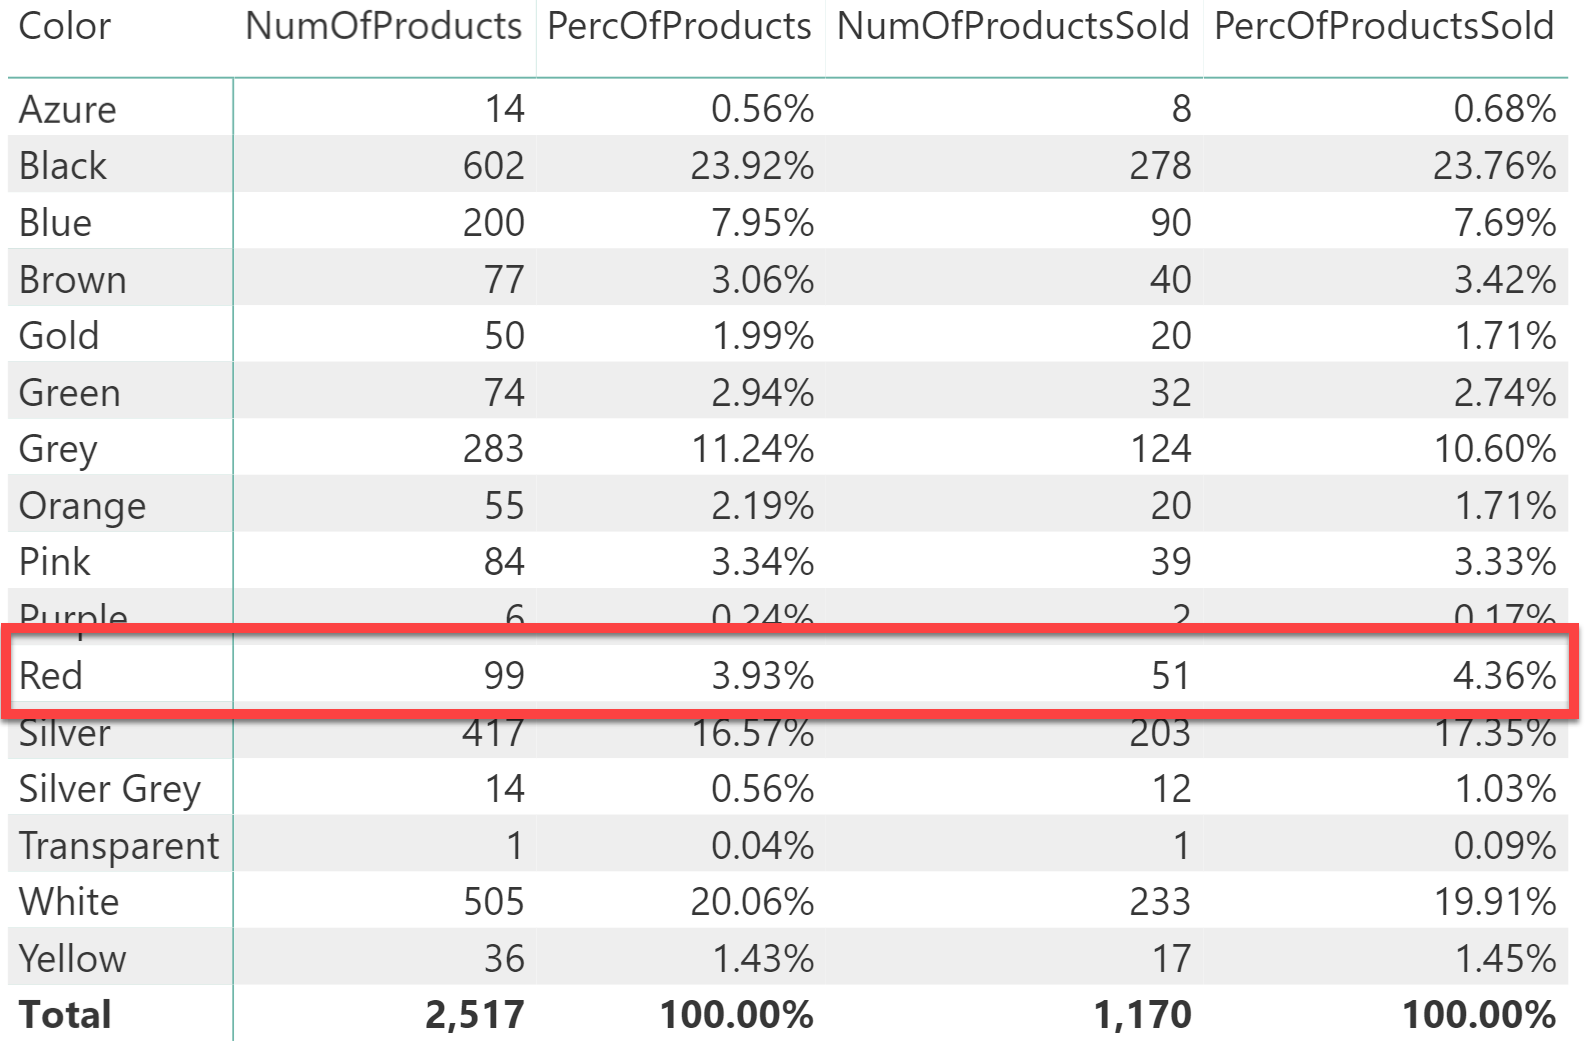
So far, everything works exactly as expected. What happens if there is the need to compute the value in the current context against the grand total? For example, the number of red products divided by the total number of products, and the number of red products sold against the total number of products sold, producing this report:

One might author the code this way:
PercOfProducts =
DIVIDE (
    [NumOfProducts],           -- Number of products
    CALCULATE (
        [NumOfProducts],       -- Number of products
        ALL ( Sales )          -- filtered by ALL Sales
)

PercOfProductsSold =
DIVIDE (
    CALCULATE (
        [NumOfProducts],       -- Number of products
        Sales                  -- filtered by Sales
    ),
    CALCULATE (
        [NumOfProducts],       -- Number of products
        ALL ( Sales )          -- filtered by ALL Sales
    )
)
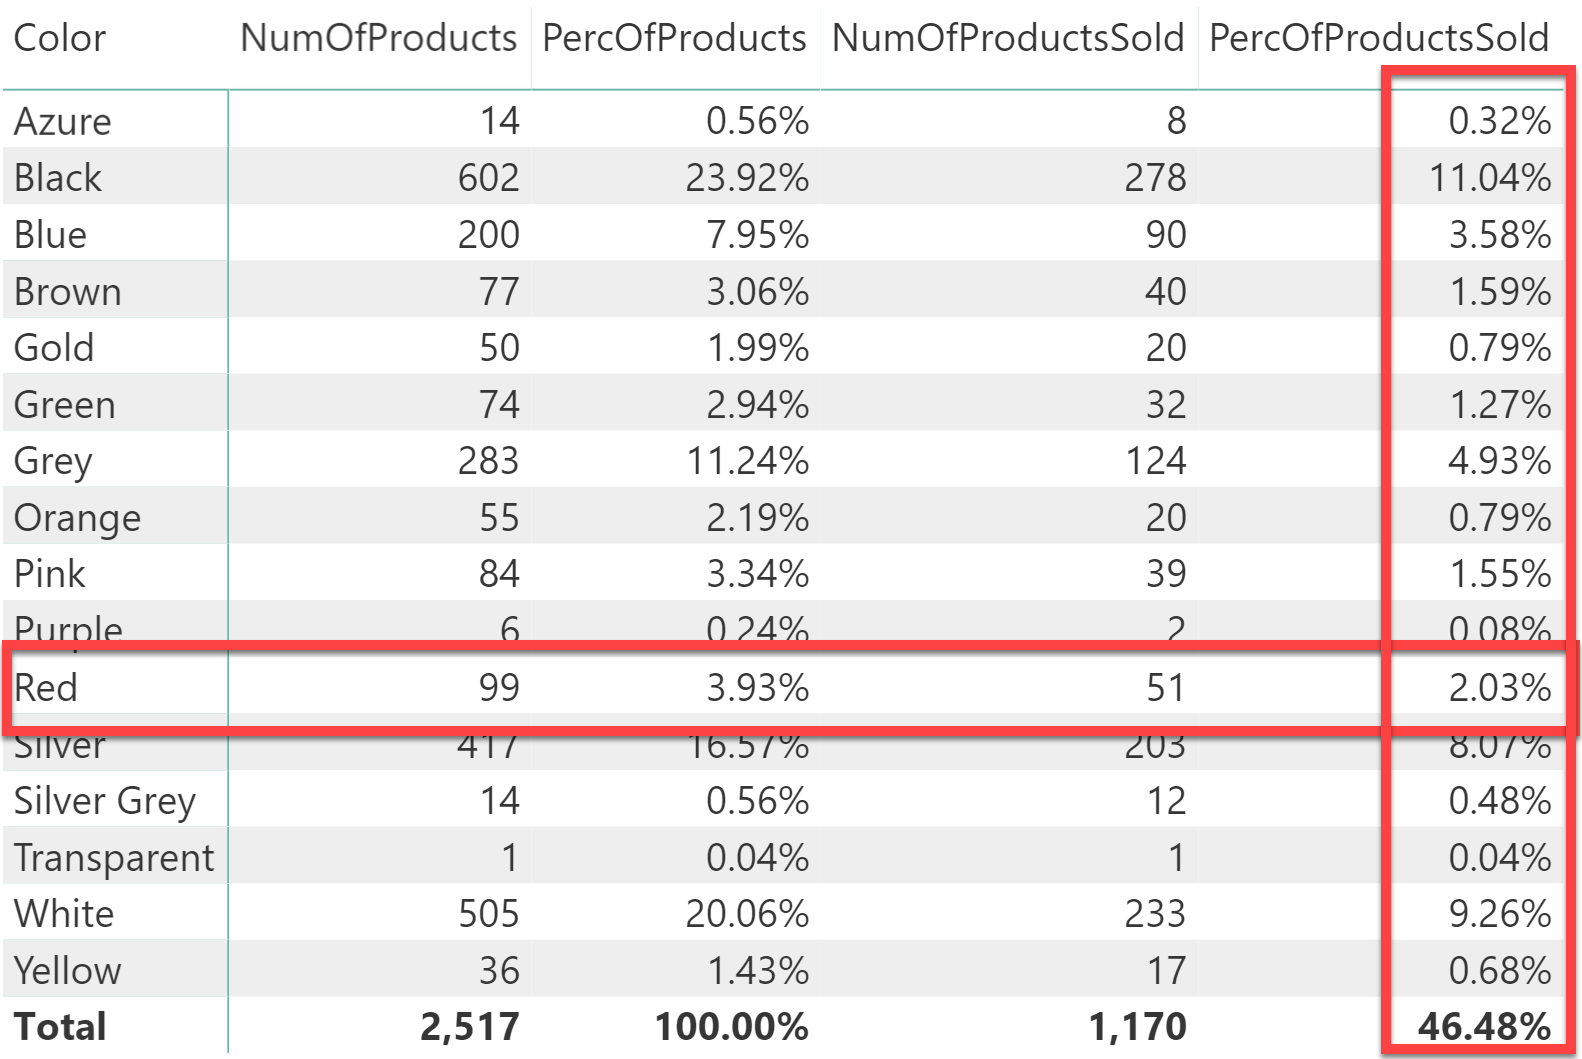
Surprisingly, this code does not produce the report above. Instead, the result looks like that:

In the PercOfProductsSold column, the percentage for red products is wrong. Here’s an explanation. First, an understanding of the subtle difference between using ALL as a filter remover and using ALL as a table function is crucial. Let us start from the beginning:
ALL is a table function that returns all the rows of a table or of a set of columns. This is the correct behavior of ALL whenever that result is actually required. In the very specific case of CALCULATE filters – and only in this specific case – ALL is not used to retrieve values from a table. Instead, ALL is used to remove filters from the filter context. Though the function name is the same, the semantics of the function is completely different.
ALL, when used as a CALCULATE filter, removes a filter. It does not return a table result.
Using a different name for the different semantics of ALL would have been a good idea. A very reasonable name would have been REMOVEFILTER.
Indeed, Microsoft introduced the REMOVEFILTERS function in Analysis Services 2019 and in Power BI since October 2019.
REMOVEFILTERS is like ALL, but it can only be used as a filter argument in CALCULATE. While REMOVEFILTERS can replace ALL, there is not replacement for ALLEXCEPT and ALLSELECTED used as CALCULATE modifiers.
Let us understand it better, by examining the denominator of PercOfSoldProducts:
PercOfProductsSold =
DIVIDE (
    CALCULATE (
        [NumOfProducts],       -- Number of products
        Sales                  -- filtered by Sales
    ),
    CALCULATE (
        [NumOfProducts],       -- Number of products
        ALL ( Sales )          -- filtered by ALL Sales
    )
)
In this case, ALL is a filter parameter of CALCULATE. As such, it acts as a REMOVEFILTERS, not as an ALL. When CALCULATE evaluates the filter in the denominator, it finds ALL. ALL requires the removal of any filters from the expanded Sales table, which includes Product[Color]. Thus, the filter is removed but no result is ever returned to CALCULATE.
Because no result is returned, the expanded Sales table is not used as a filter by CALCULATE. At the risk of being pedantic, here is the same code with the REMOVEFILTERS function instead of ALL:
PercOfProductsSold =
DIVIDE (
    CALCULATE (
        [NumOfProducts],           -- Number of products
        Sales                      -- filtered by Sales
    ),
    CALCULATE (
        [NumOfProducts],           -- Number of products
        REMOVEFILTERS ( Sales )    -- with filters removed by Sales
    )
)
Using ALL ( Sales ) does not mean, “filter using all the rows in Sales”. It means, “remove any filters from Sales”. With this small change in how the formula reads, it is now clear that the number of products is the total number of products if no filter is ever applied. Thus, the denominator always computes 2,517 instead of 1,170. This explains why the percentage goes from 4.36% to 2.03%.
This behavior definitely seems strange. Nevertheless, as is often the case with DAX, the behavior is not strange at all, that’s just the way it is. If it does not meet our expectations – then the problem is our limited knowledge, not the behavior itself.
At this point, it is interesting to look at how to properly write the formula. As shown, ALL is not enough because it does not return its value, it only removes filters. An option is to still use ALL, but move it inside an outer CALCULATETABLE. By doing this, ALL still behaves like a REMOVEFILTERS, but CALCULATETABLE forces the result back:
PercOfProductsSold =
DIVIDE (
    CALCULATE (
        [NumOfProducts],
        Sales
    ),
    CALCULATE (
        [NumOfProducts],
        CALCULATETABLE ( ALL ( Sales ) )
    )
)
Using CALCULATETABLE outside of ALL looks like a trick, but it is not. It actually changes the semantics of the formula, making it explicit that the result of ALL ( Sales ) is needed in order to filter the formula. A similar behavior can be obtained with a less elegant formula:
PercOfProductsSold =
DIVIDE (
    CALCULATE (
        [NumOfProducts],
        Sales
    ),
    CALCULATE (
        [NumOfProducts],
        FILTER ( ALL ( Sales ), 1 = 1 )
    )
)
In this case it is FILTER that forces the result of ALL ( Sales ) to be returned, by using a dummy filter with a condition that always evaluates to TRUE.
It is worth noting that all the tables used as filter arguments are, indeed, expanded tables. Therefore, the action of removing filters impacts not only the base table but the entire expanded table. ALL ( Sales ) acts as REMOVEFILTERS on the expanded version of Sales, removing filters from the table and from all related dimension.
This behavior is particularly important in the case of ALLEXCEPT. Consider the following measure:
NoFilterOnProduct =
    CALCULATE (
        [Sales Amount],
        ALLEXCEPT ( Sales, Sales[ProductKey] )
    )
One might think that ALLEXCEPT removes all filters from the columns in the Sales table except for the ProductKey column. However, the behavior is noticeably different. ALLEXCEPT removes filters from the expanded version of Sales, which includes all the tables that can be reached through a many-to-one relationship starting from Sales. This includes customers, dates, stores, and any other dimension table.
The following syntax prevents ALLEXCEPT from removing filters from a specific table:
NoFilterOnProduct =
    CALCULATE (
        [Sales Amount],
        ALLEXCEPT (
            Sales,
            Sales[ProductKey],
            Date,
            Customer,
            Store
        )
    )
In this example, ALLEXCEPT uses one column and three tables as arguments. One can use any table or column that is contained in the expanded version of the table used as the first argument.
The behavior shown in this article applies to four functions: ALL, ALLNOBLANKROW, ALLEXCEPT and ALLSELECTED. They are usually referred to as the ALLxxx functions. Importantly, ALL and ALLNOBLANKROW hide no other surprises, whereas ALLSELECTED is a very complex function. ALLSELECTED is thoroughly covered in the article, The definitive guide to ALLSELECTED. ALLSELECTED merges two of the most complex behaviors of DAX in a single function: shadow filter contexts and acting as REMOVEFILTERS instead of a regular filter context intersection.
For anyone wondering what the most complex DAX function is, now there is a clear winner: it is ALLSELECTED.
Evaluates an expression in a context modified by filters.
CALCULATE ( <Expression> [, <Filter> [, <Filter> [, … ] ] ] )
Returns all the rows in a table, or all the values in a column, ignoring any filters that might have been applied.
ALL ( [<TableNameOrColumnName>] [, <ColumnName> [, <ColumnName> [, … ] ] ] )
Evaluates a table expression in a context modified by filters.
CALCULATETABLE ( <Table> [, <Filter> [, <Filter> [, … ] ] ] )
Clear filters from the specified tables or columns.
REMOVEFILTERS ( [<TableNameOrColumnName>] [, <ColumnName> [, <ColumnName> [, … ] ] ] )
Returns all the rows in a table except for those rows that are affected by the specified column filters.
ALLEXCEPT ( <TableName>, <ColumnName> [, <ColumnName> [, … ] ] )
Returns all the rows in a table, or all the values in a column, ignoring any filters that might have been applied inside the query, but keeping filters that come from outside.
ALLSELECTED ( [<TableNameOrColumnName>] [, <ColumnName> [, <ColumnName> [, … ] ] ] )
Returns a table that has been filtered.
FILTER ( <Table>, <FilterExpression> )
Returns all the rows except blank row in a table, or all the values in a column, ignoring any filters that might have been applied.
ALLNOBLANKROW ( <TableNameOrColumnName> [, <ColumnName> [, <ColumnName> [, … ] ] ] )
 Alberto Ferrari