When you write a measure in DAX, its logic is recalculated in every cell of a visualization. Sometimes, the result at the total level does not correspond to the sum of the rows visible in the visual, because the logic in DAX aggregates the numbers using a different logic. For example, consider a simple calculation that divides the sales amount by the number of working days.
We work off of these three pre-existing measures:
Sales Amount :=
SUMX (
    Sales,
    Sales[Quantity] * Sales[Net Price]
)

WorkingDays :=
CALCULATE (
    COUNTROWS ( 'Date' ),
    'Date'[Working Day] = "WorkDay"
)

SalesPerWorkingDay :=
DIVIDE (
    [Sales Amount],
    [WorkingDays]
)
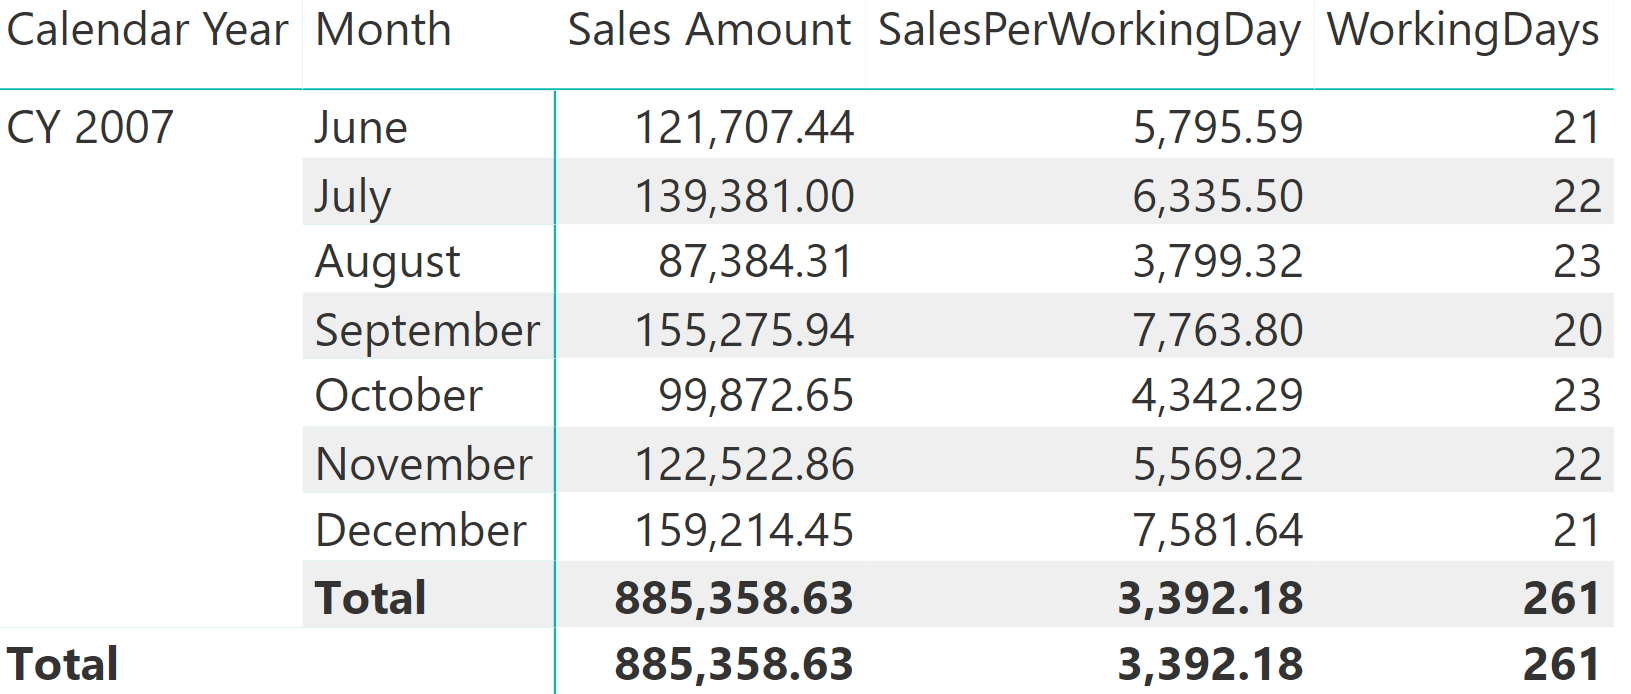
These measures produce the correct figures month by month. However, at the year level the number of working days might be too big whenever there are incomplete months – this always happens before the end of the year, or when the first month with sales is not January as in the following example. As you can see in the following figure, in this case the yearly value of SalesPerWorkingDays is lower than the value of any month, which does not make much sense.

At the total level, the number of working days includes the first five months of the year, which are months without sales. In order to accurately compute the sales per working days, you must ignore the working days of the months with no sales. A simple change to the WorkingDays measure does not produce the correct result:
WorkingDays :=
IF (
     [Sales Amount] > 0,
     CALCULATE ( COUNTROWS ( 'Date' ), 'Date'[Working Day] = "WorkDay" )
)
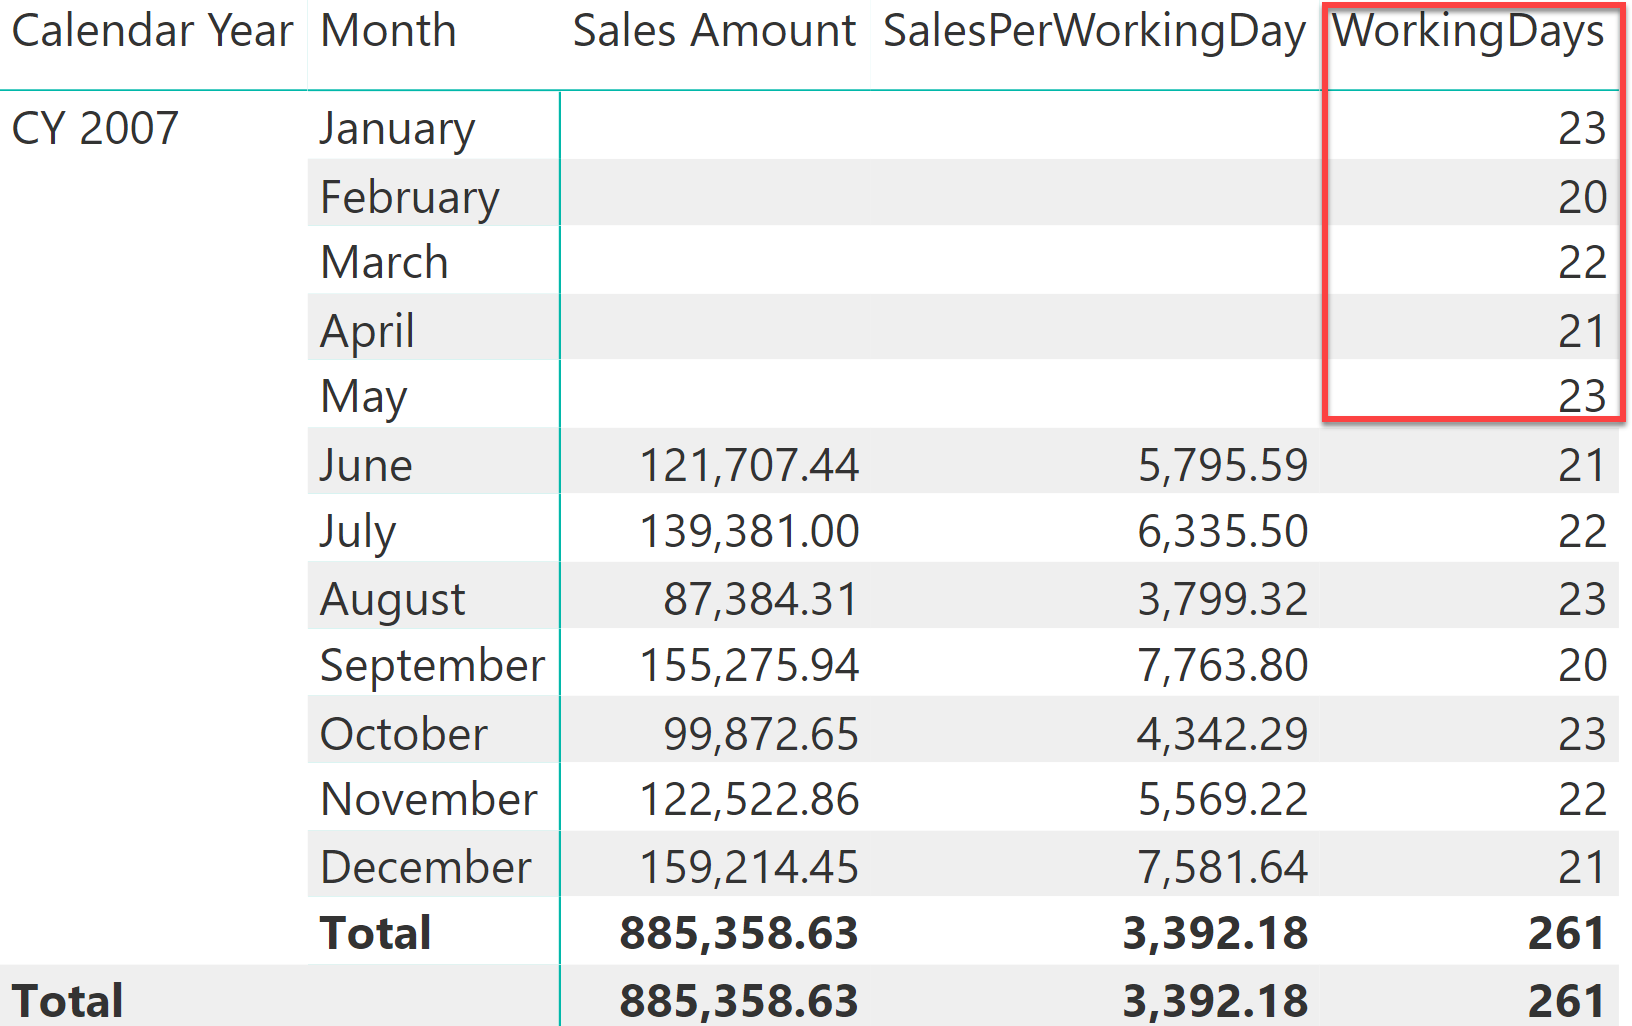
Indeed, the result is even harder to read than before: Although the months with no sales have disappeared from the report, they are still being considered at the year level.

Focus on this: you want the total of WorkingDays to be the sum of the visible rows, whereas you want to compute the SalesPerWorkingDay measure as a ratio between Sales Amount and WorkingDays regardless of the cardinality of the report – the same formula should be used for both the month and the year levels. Instead, the total of WorkingDays is computed in its own filter context. At the year level, the value of Sales Amount is greater than zero. Therefore, the number of working days returned is the number of working days across the entire year, just as in the previous example.
Solving the scenario is simple: whenever you have a calculation that works fine at the month level but produces a wrong result at the year level, you need to control the granularity to evaluate the DAX expression in a measure. Because you want the year to be computed as the sum of the individual months for WorkingDays, then you must force the calculation at the month level, aggregating the partial results at a different level of granularity.
Here is the correct solution:
WorkingDays :=
SUMX (
    KEEPFILTERS ( VALUES ( 'Date'[Calendar Year Month] ) ),
    IF (
        [Sales Amount] > 0,
        CALCULATE ( COUNTROWS ( 'Date' ), 'Date'[Working Day] = "WorkDay" )
    )
)
NOTE: The original version didn’t have the KEEPFILTERS function at line 3. It is usually unnecessary if you correctly iterate the granularity required, like the column containing year and month in this case. However, in order to avoid issues with arbitrarily shaped filters, KEEPFILTERS is helpful. Read this article for more details: When to use KEEPFILTERS over iterators.
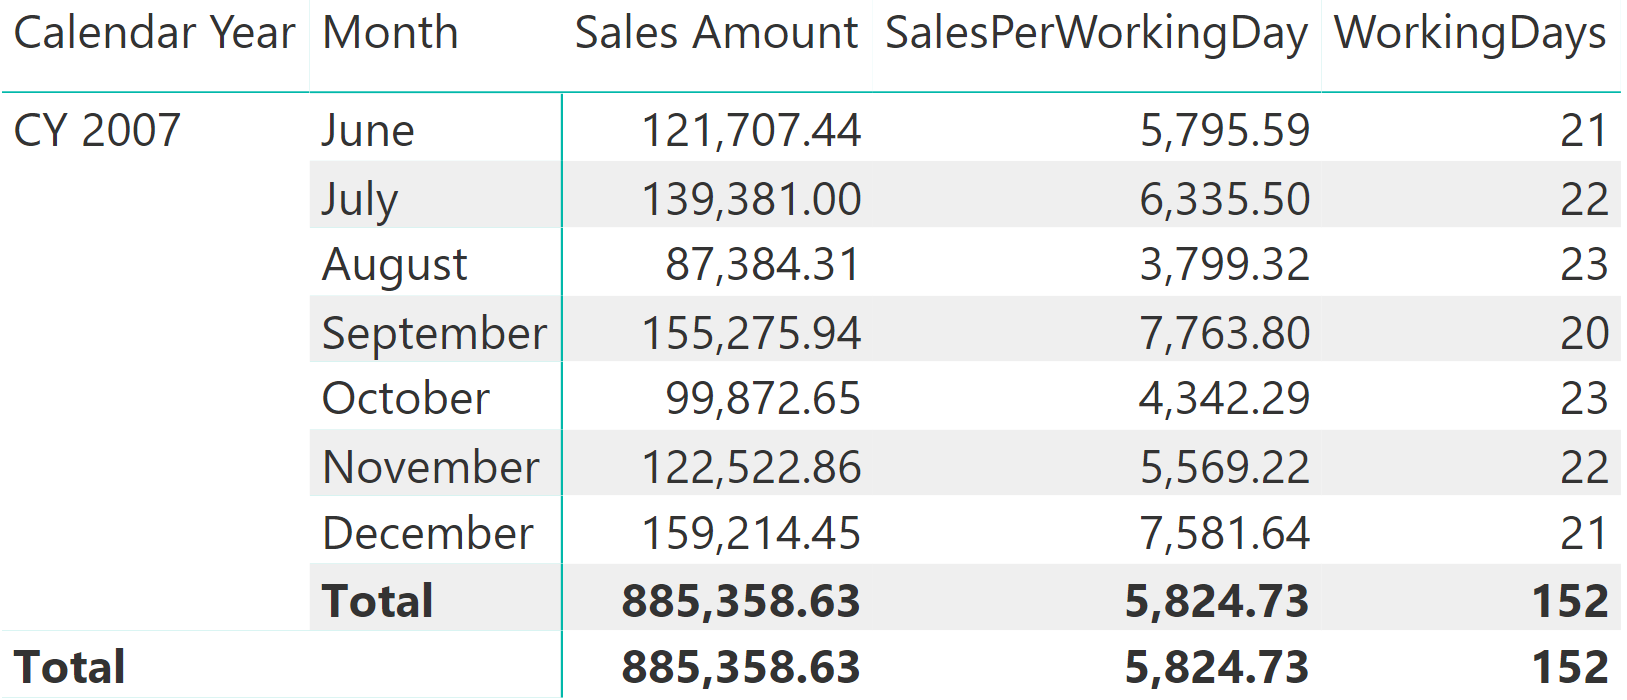
By iterating over each month, the value is computed month by month leading to blank when there are no sales. When the filter context is filtering the entire year, this latter formula computes the values for every month and then aggregates the partial results, as you can see in the following figure.

At this point, because WorkingDays computes correctly at the year level, SalesPerWorkingDay also provides an accurate result.
This scenario is one specific case within a much broader topic, that is how to enforce a calculation at the correct granularity. Experienced data modelers know very well that some calculations can only be done at a specific granularity, whereas less experienced developers sometimes find it hard to solve simple scenarios like the one presented.
Changes the CALCULATE and CALCULATETABLE function filtering semantics.
KEEPFILTERS ( <Expression> )
Articles in the DAX 101 series
- Computing running totals in DAX
- Counting working days in DAX
- Summing values for the total
- Year-to-date filtering weekdays in DAX
- Creating a simple date table in DAX
- Automatic time intelligence in Power BI
- Using CONCATENATEX in measures
- Previous year up to a certain date
- Sorting months in fiscal calendars
- Using USERELATIONSHIP in DAX
- Mark as Date table
- Row context in DAX
- Filter context in DAX
- Introducing CALCULATE in DAX
- Understanding context transition in DAX
- Using KEEPFILTERS in DAX
- Variables in DAX
- Using RELATED and RELATEDTABLE in DAX
- Introducing ALLSELECTED in DAX
- Introducing RANKX in DAX
 Alberto Ferrari