 Marco Russo & Alberto Ferrari
As of October 2024, Power BI does not have a built-in feature to manage calendars based on weeks. The out-of-the-box feature available (Auto date/time) creates a date table based on a standard Gregorian calendar with 12 months and 365 or 366 days for each year. However, comparing data month over month implies comparing a different number of working days in each month.
Many businesses have a strong dependency on the number of working days and weekends for many metrics the users want to compare. In those cases, it is common to use a different calendar based on weeks: every period (like month, quarter, or year) aggregates complete weeks, thus losing the alignment with the underlying Gregorian calendar and keeping the same number of working days in each period. This article explores the differences between the two techniques (month- and week-based) when there is a year-over-year comparison, and introduces tools to implement those techniques.
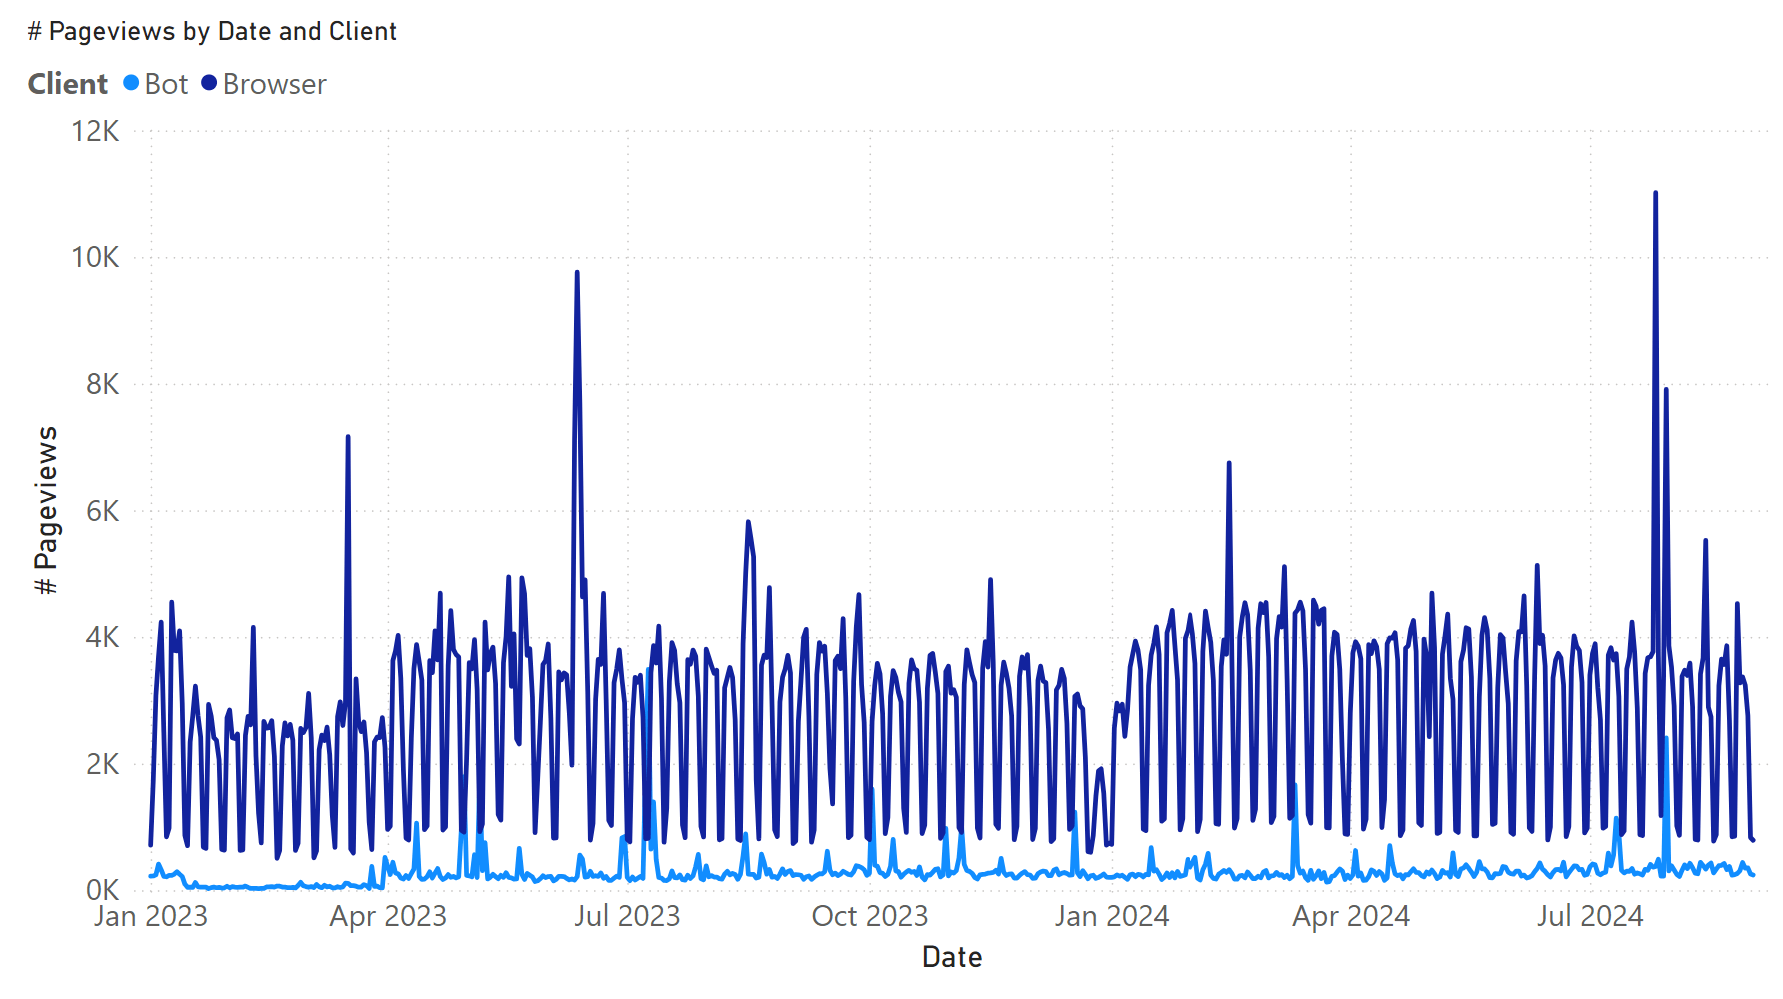
Weekly calendars are common in manufacturing, retail, and any business that is sensitive to weekends or to the number of working days. For example, the scenario described in this article uses the number of pageviews on a website from 2019 to 2024, with data available until September 3, 2024. The website analyzed has a clear weekly trend, with slower traffic over the weekend, as shown in the following line chart with a daily granularity. It seems like a business website. A sports website would probably display the opposite trend.
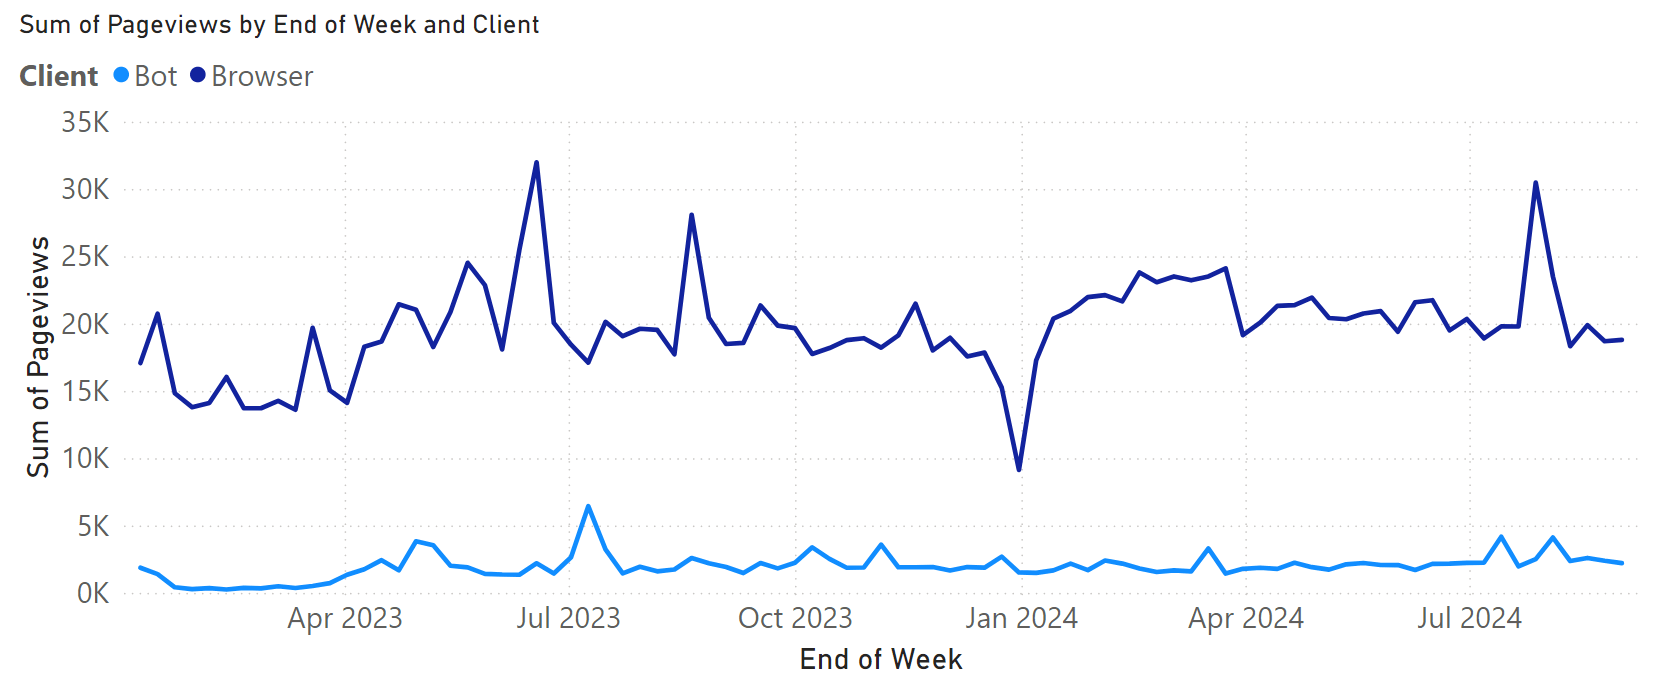
The same data with a weekly granularity makes it easier to see the longer-term trends and the impact of exceptions.
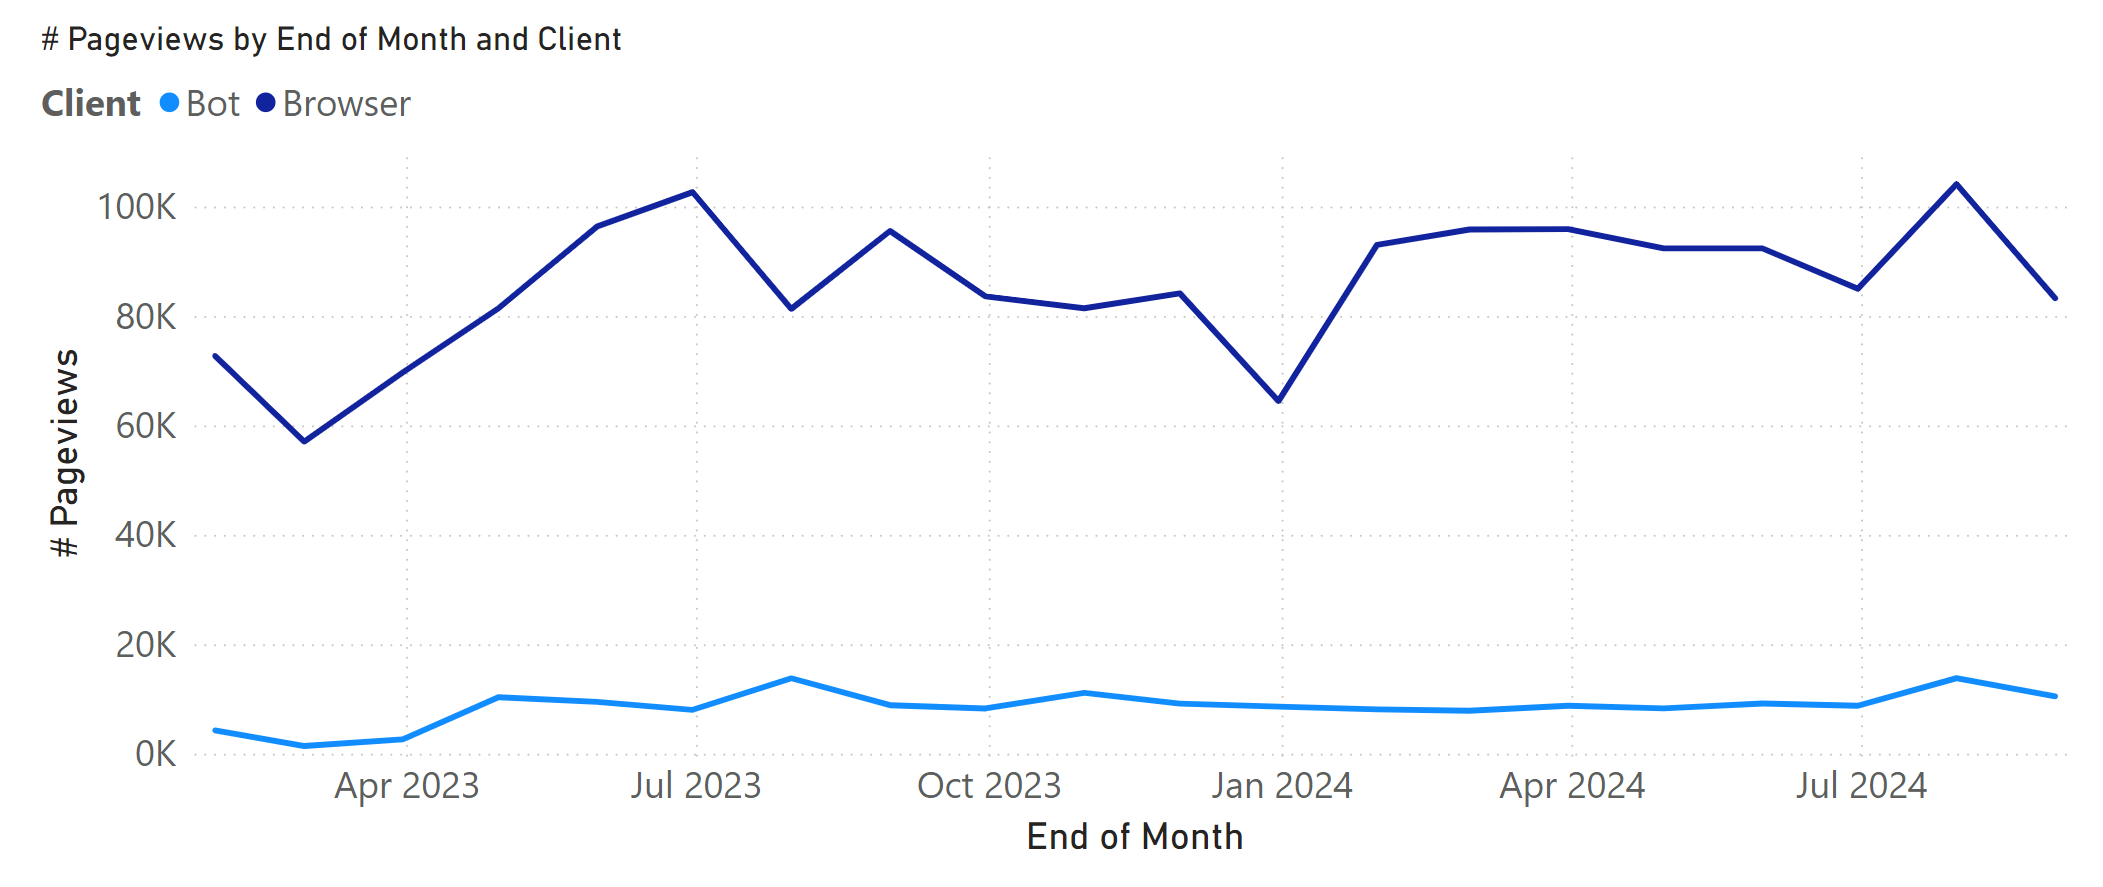
With a monthly granularity, the trend seems even smoother. However, slight differences could be caused by the different number of working days present in each month.
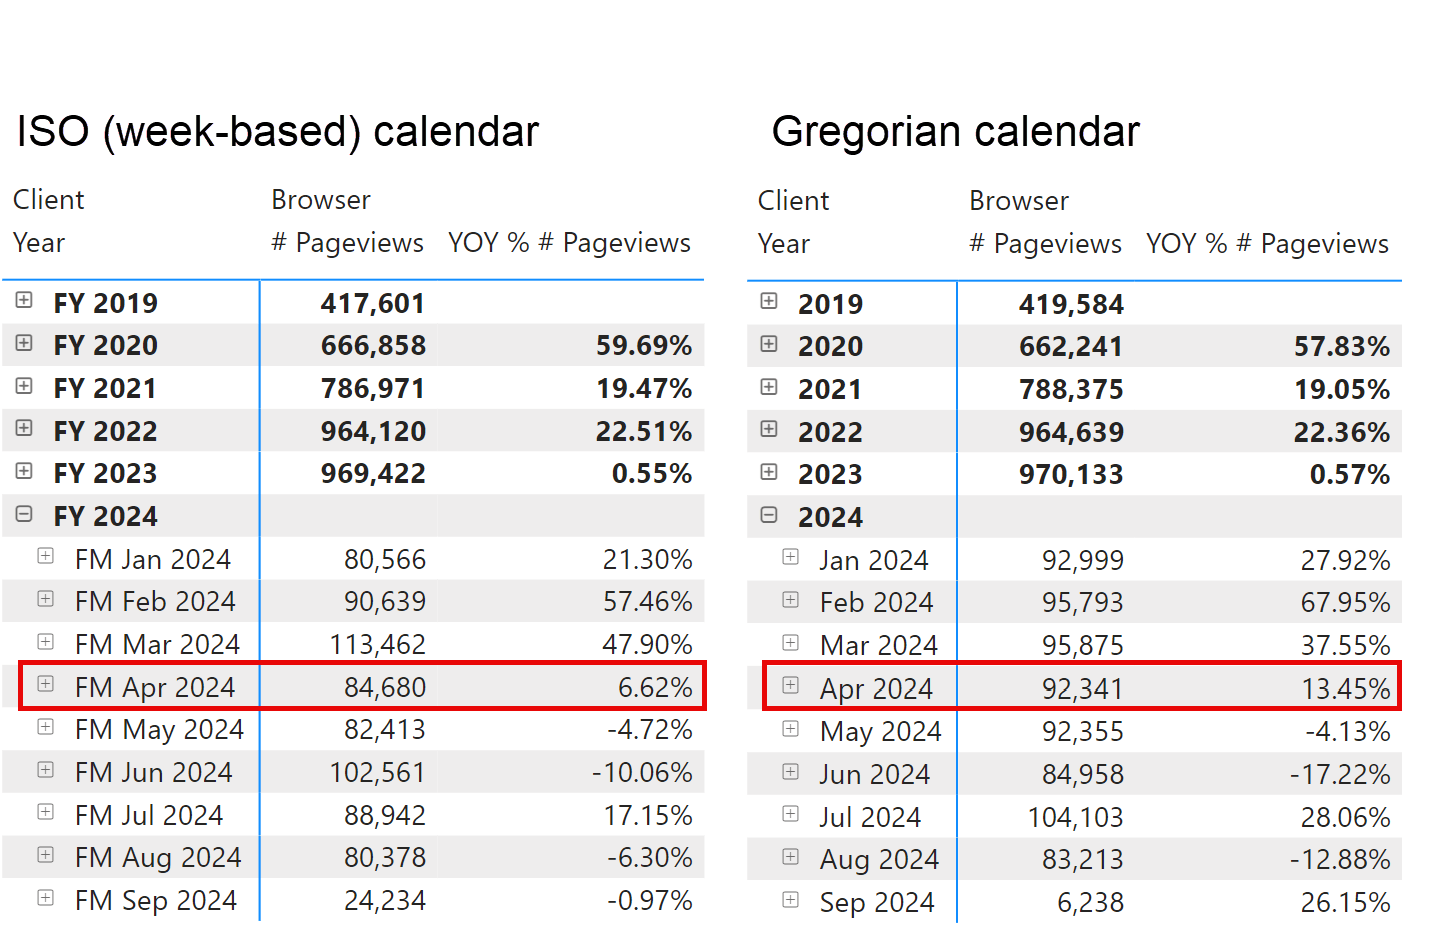
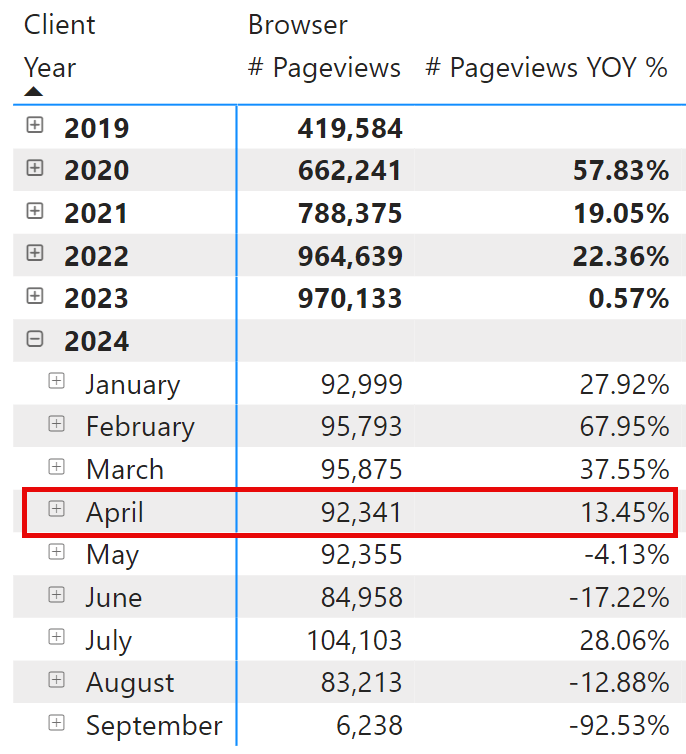
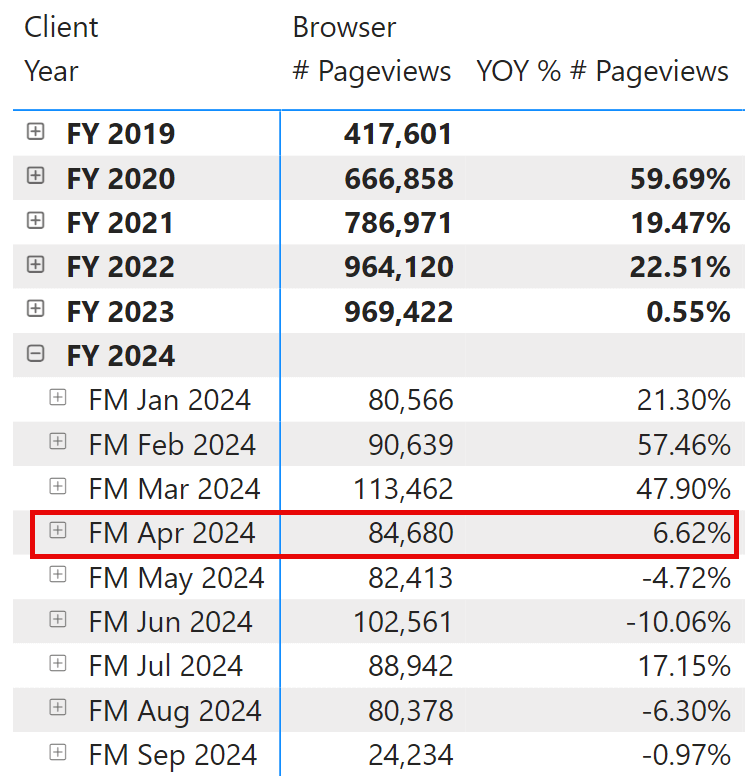
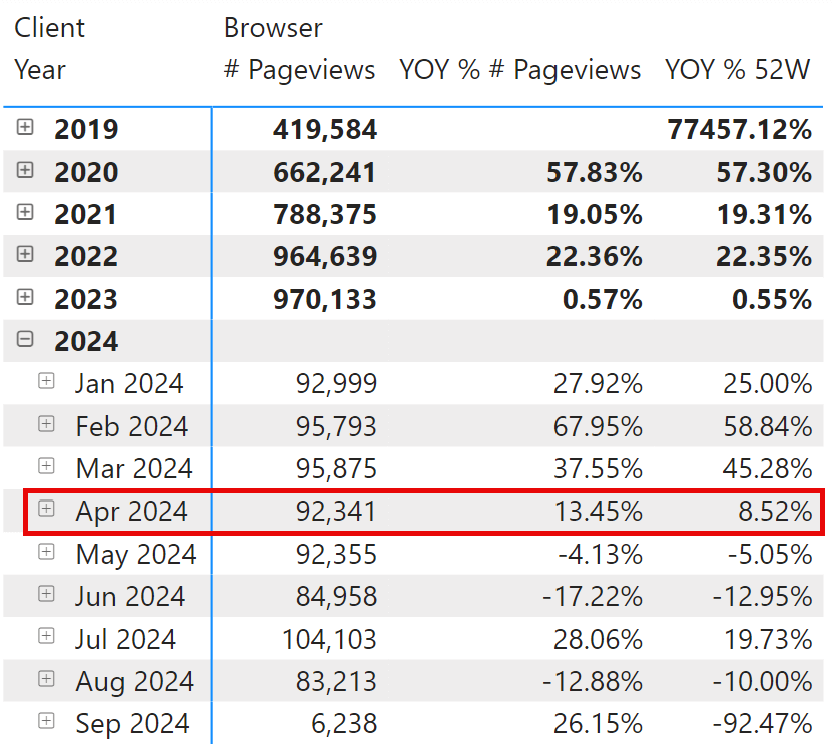
These differences are more evident when we compare the year-over-year percentage difference (YOY %) between the pageviews grouped by month in a Gregorian calendar and an ISO 4-4-5 week-based calendar. For example, the growth in April 2024 is inflated in the Gregorian calendar, showing 13.45% vs. a good but lower 6.62% provided by the week-based calendar.
In this article, we explore and review our Power BI options to build reports that compare data using weeks instead of calendar months as the base unit of comparison.
Month-based comparison with auto date/time
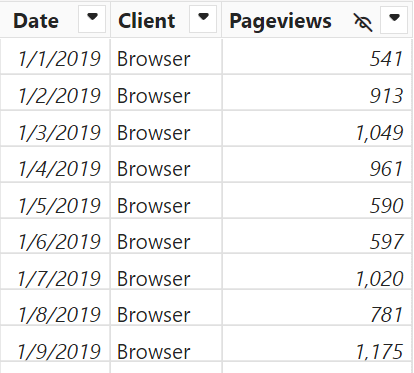
The model we analyze is straightforward. We are looking at just one table imported from a CSV file with three columns: Date, Client, and Pageviews. The Client column describes the type of incoming traffic (whether generated by a Bot or by a Web Browser).
By enabling the Auto date/time feature, we get a hidden Date table shown through the Date Hierarchy structure.

The hidden Date table cannot be customized and does not provide any aggregation by week. The comparison with the previous year can be implemented in DAX using the SAMEPERIODLASTYEAR function, which receives the Date column reference using the column variation syntax pageviews[Date].[Date]:
# Pageviews YOY % =
VAR _Current = [# Pageviews]
VAR _Previous = CALCULATE ( [# Pageviews], SAMEPERIODLASTYEAR ( 'pageviews'[Date].[Date] ) )
VAR _Difference = _Current - _Previous
VAR Result = DIVIDE ( _Difference, _Previous )
RETURN IF ( NOT ISBLANK( _Previous ) && NOT ISBLANK( _Current ), Result )
April always has 30 days. However we are comparing the value of April 2024, which has 22 working days, with the value of April 2023, that has only 20 working days – Easter fell on different days, which can affect the comparison.
Besides a possible comparison using a 52-week offset we describe later, you cannot create a weekly-based chart or matrix using the Date table generated automatically by Power BI.
Getting a free Date table
Before creating a week-based Date table, we want to introduce how to get a Date table that can be customized. Bravo for Power BI is a free, open-source external tool that creates a calculated Date table using one of the many configurable patterns available.
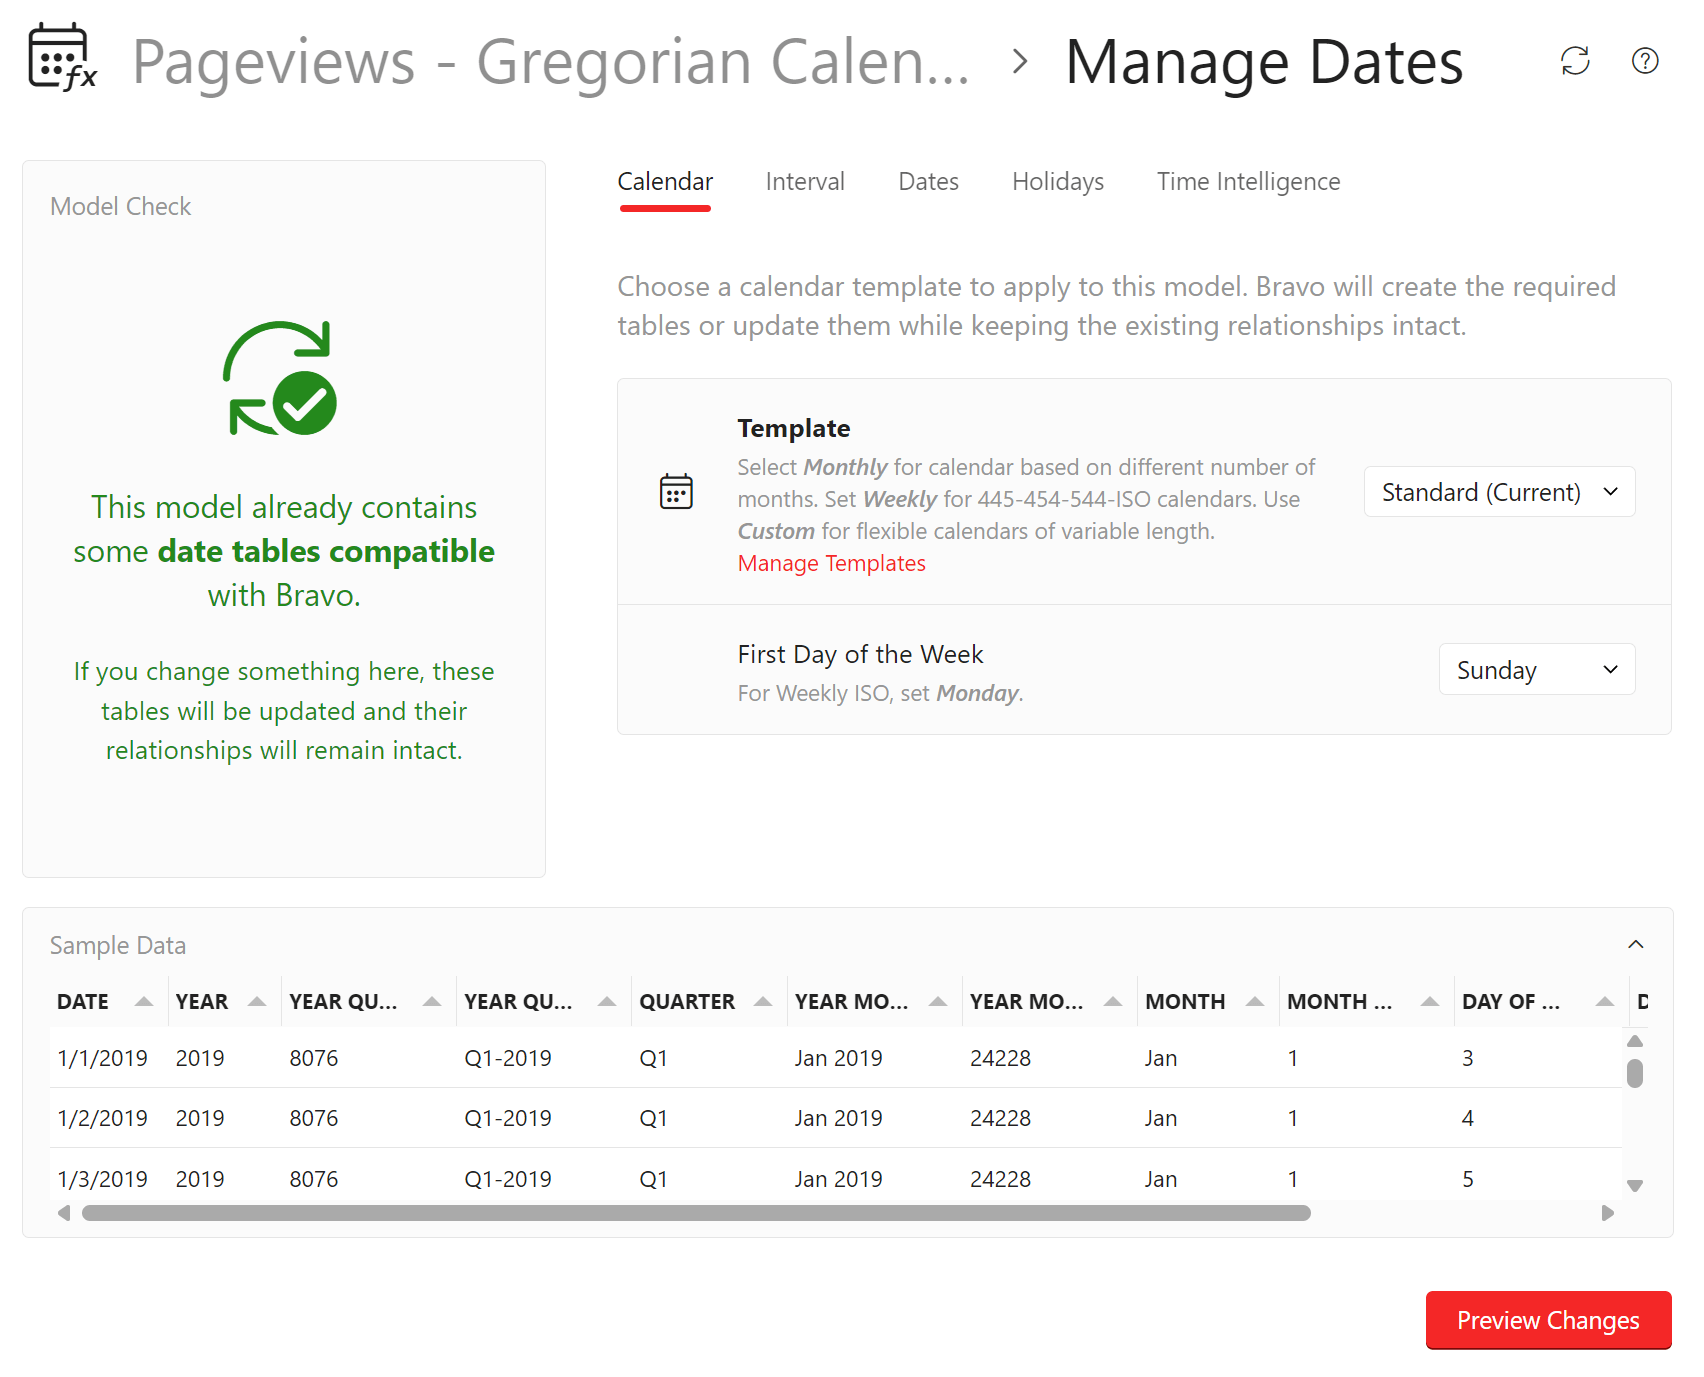
The file “Pageviews – Gregorian Calendar.pbix” contains a Date table created by Bravo. The monthly results obtained are the same as what we have seen with the Auto Date/Time feature. However, we need a single Date table when we have more than one date column in the model, either in the same table or in different tables. The sample model we use has a single table and a single Date column. However, Bravo also creates all the time intelligence calculations we need on the selected measures.
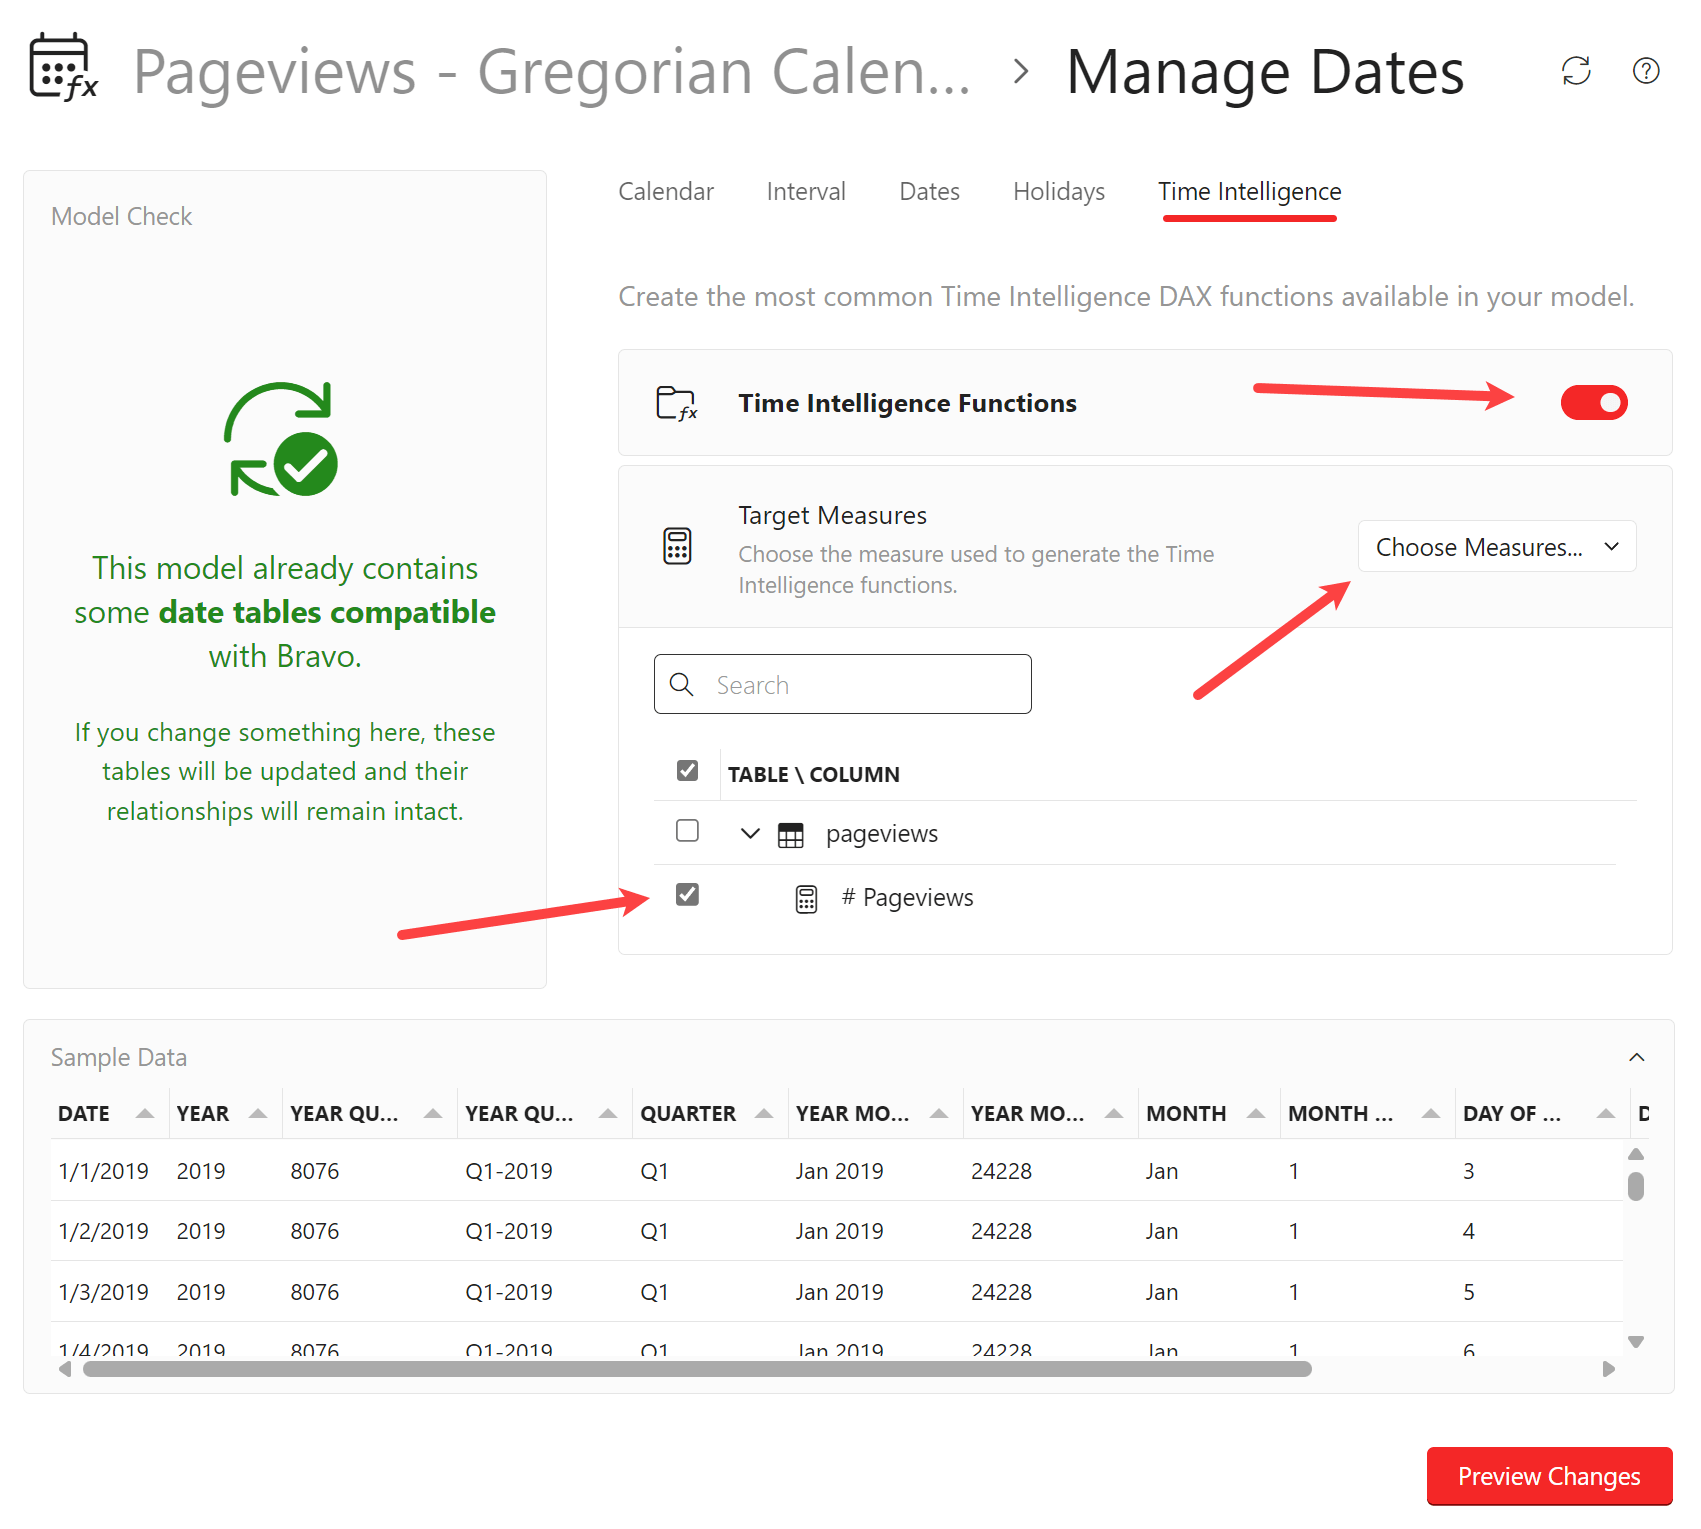
The measures added by Bravo are nested in specific folders and easily discoverable by using the search textbox.
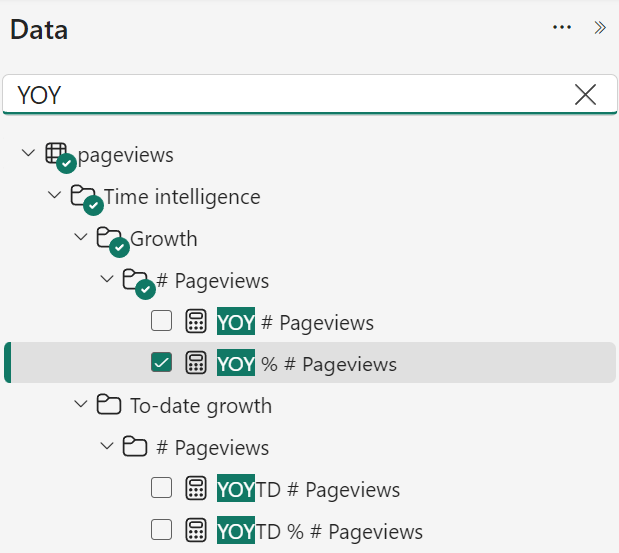
This is the DAX code generated automatically by Bravo to support the YOY % # Pageviews measure:
YOY % # Pageviews =
DIVIDE (
    [YOY # Pageviews],
    [PY # Pageviews]
)
YOY # Pageviews =
VAR __ValueCurrentPeriod = [# Pageviews]
VAR __ValuePreviousPeriod = [PY # Pageviews]
VAR __Result =
    IF (
        NOT ISBLANK ( __ValueCurrentPeriod ) && NOT ISBLANK ( __ValuePreviousPeriod ),
        __ValueCurrentPeriod - __ValuePreviousPeriod
    )
RETURN
    __Result
PY # Pageviews =
IF (
    [_ShowValueForDates],
    CALCULATE (
        [# Pageviews],
        CALCULATETABLE (
            DATEADD ( 'Date'[Date], -1, YEAR ),
            'Date'[DateWithTransactions] = TRUE
        )
    )
)
However, using a different template, Bravo can create a different Date table based on weeks.
Implementing ISO (4-4-5) week-based calendar
When we want to analyze data by week, the first challenge is that a month is not a group of weeks. A week could have days in two different months. Therefore, there are various techniques to create an aggregation of weeks to compare different periods.
A widely used approach with many variations is based on the definition of a year with 52 weeks. This way, one year always has 364 days that can be grouped into four quarters, each with 13 weeks, meaning 91 days. Each quarter has three periods, each with 4 or 5 weeks. Every quarter has the same sequence of periods, so the possible combinations are 4-4-5, 4-5-4, and 5-4-4. For example, in the 4-4-5 weekly calendar, the first two periods of each quarter are always four weeks, and the last period is always five weeks.
We prefer to use the term “period” because “months” in a week-based calendar do not match their Gregorian counterpart. For example, the first quarter of 2023 has 90 days in the Gregorian calendar and 91 days in the 4-4-5 calendar. We name the periods after the month that is most widely represented inside. For example, the first period is called January simply because it mostly holds days from the month of January. But it is not an exact match. You might see that the each period in a 4-4-5 calendar is named after the month most represented in the period, so in this case 28 days for January and February and 35 days for March. The prefix “FM” used in the Month column stands for “Fiscal Month”, because the underlying period does not match the days of the Gregorian calendar month!
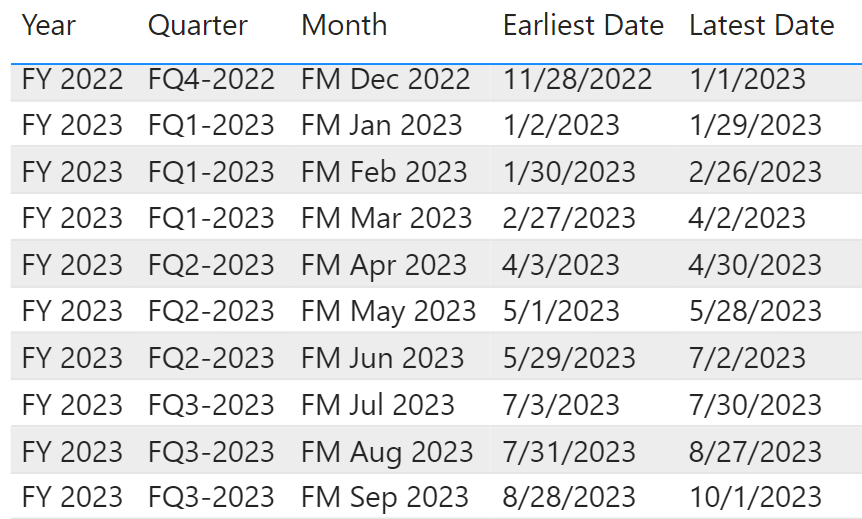
The last day of 2022 is January 1st, 2023. The first day of “FM February 2023” is January 30th, 2023, so the last two days of February are in “FM March 2023”. However, the confusion is only generated because we are using the same month names as in the Gregorian calendar. What matters is that the first period of each quarter has the same number of days, weeks, and weekdays, making it easy to compare it in different quarters and years.
Similarly, the quarters in a 4-4-5 calendar also do not match those in a Gregorian calendar.
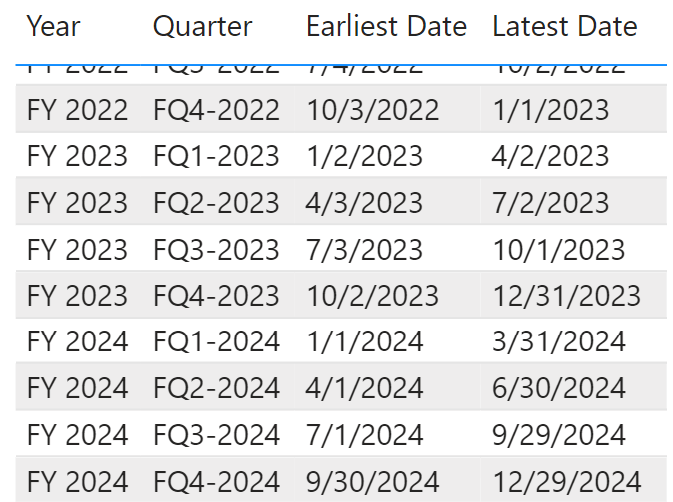
To align the week calendar to the Gregorian calendar, every 6-7 years, an additional week is applied to the last period of the last quarter, which becomes 4-4-6, 5-4-5, or 4-5-5. However, that extra week could be ignored for the comparisons, even though a standardized practice does not exist.
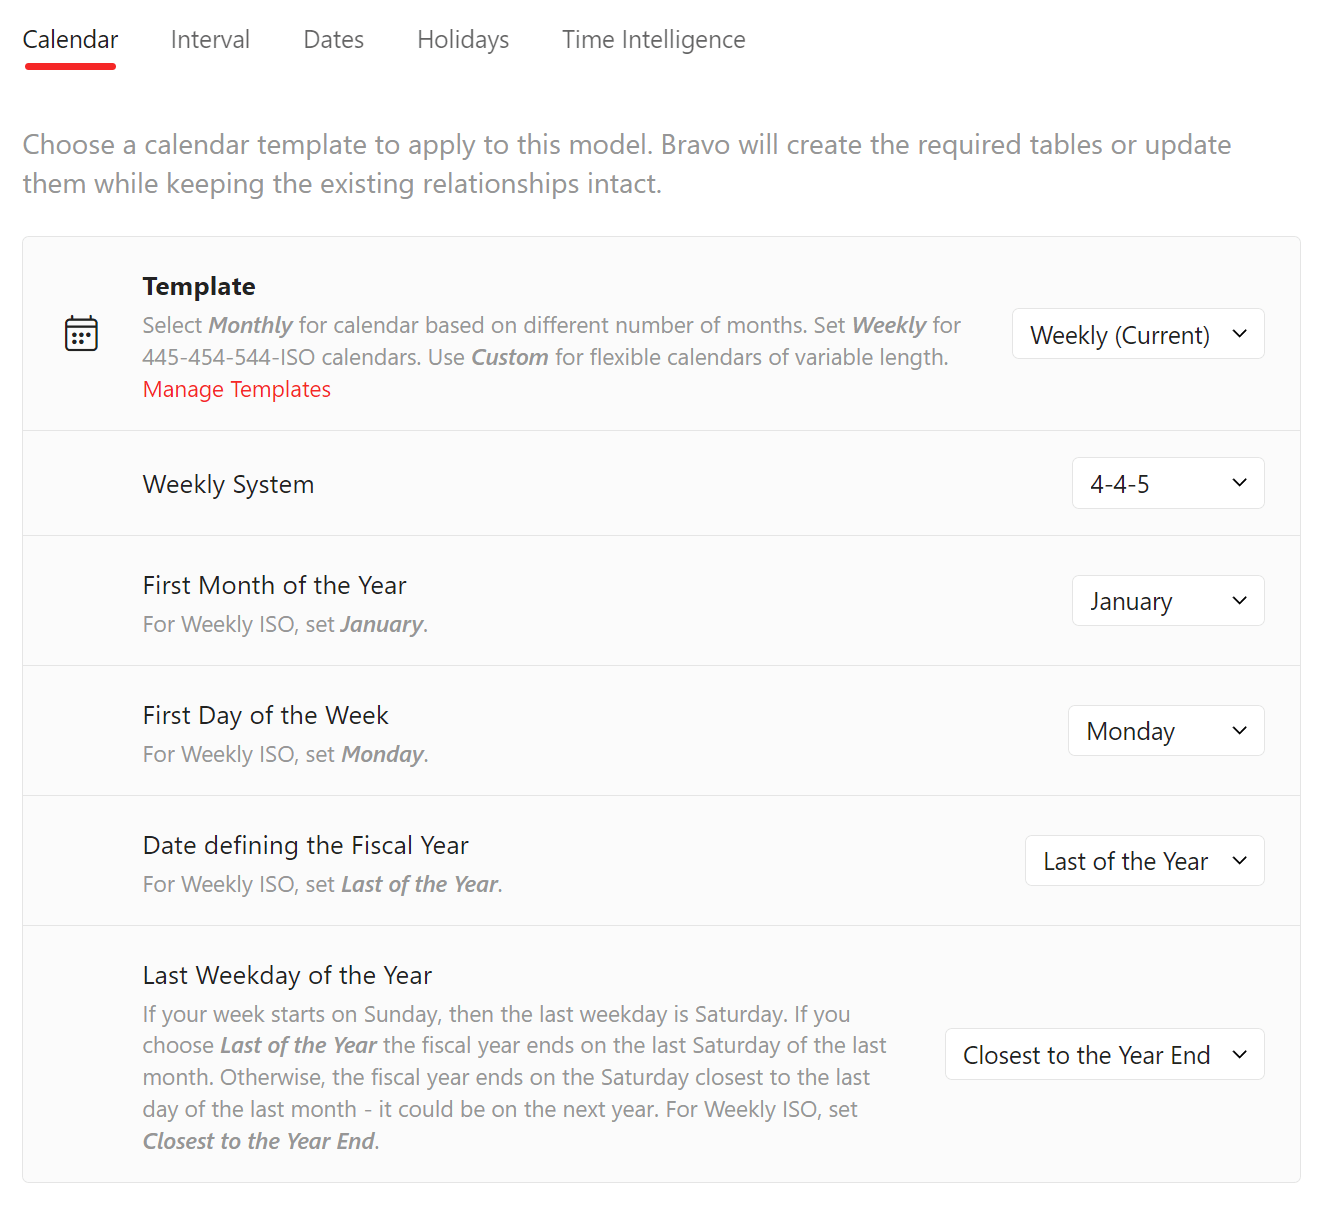
Using Bravo, we can obtain a Date table that supports a week-based calendar with just a few clicks. The following configuration supports the ISO-8601 standard for week numbering in a 4-4-5 calendar. However, you can choose a different set of parameters to align with the standard adopted by your company. For example, US companies usually use Sunday as the first day of the week and may use different settings to define the last weekday of the year.
Bravo also creates the time intelligence measures for the selected template. For example, this is the definition of the YOY % # Pageviews measure:
YOY % # Pageviews =
DIVIDE (
    [YOY # Pageviews],
    [PY # Pageviews]
)
YOY # Pageviews =
VAR __ValueCurrentPeriod = [# Pageviews]
VAR __ValuePreviousPeriod = [PY # Pageviews]
VAR __Result =
    IF (
        NOT ISBLANK ( __ValueCurrentPeriod ) && NOT ISBLANK ( __ValuePreviousPeriod ),
        __ValueCurrentPeriod - __ValuePreviousPeriod
    )
RETURN
    __Result
PY # Pageviews =
IF (
    [_ShowValueForDates],
    SUMX (
        VALUES ( 'Date'[Fiscal Year Number] ),
        VAR __CurrentFiscalYearNumber = 'Date'[Fiscal Year Number]
        VAR __DaysSelected =
            CALCULATETABLE (
                VALUES ( 'Date'[Day of Fiscal Year Number] ),
                REMOVEFILTERS ( 'Date'[Day of Week Number], 'Date'[Day of Week] ),
                'Date'[DateWithTransactions] = TRUE
            )
        RETURN
            CALCULATE (
                [# Pageviews],
                'Date'[Fiscal Year Number] = __CurrentFiscalYearNumber - 1,
                __DaysSelected,
                ALLEXCEPT ( 'Date', 'Date'[Day of Week Number], 'Date'[Day of Week] )
            )
    )
)
PY #Pageviews applies a filter by selecting the same relative days in the previous fiscal year. A full description of the techniques used to implement time intelligence calculations on a week-based calendar is available in the Week-related calculations pattern at www.daxpatterns.com.
The calculation for April 2024 aggregates 28 days because it is the first period in a quarter for the 4-4-5 calendar. YOY % # Pageviews compares April 1-28, 2024, with April 3-30, 2023, using the same number of weekdays.
However, working with weeks is not compatible with scenarios where we need numbers that correspond to the totals by month in a Gregorian calendar. Some companies use the week number within the Gregorian calendar year and accept that a week may be truncated at the beginning or end of the year. However, in those scenarios, the comparison by week is never mixed with aggregations by month and quarter. Another approach is possible in order to avoid this: using the weeks strictly for comparison, and not for reporting.
Year-over-year comparison with a 52-week shift
Using a week-based calendar produces a year total that usually does not match the fiscal year of the company. Indeed, it is common to have a fiscal year that matches whole months in the Gregorian calendar. For example, many companies have a fiscal year starting on the first day of a month, like January 1st or July 1st. Every year should begin on the same day of the month, and this is a requirement to use the standard DAX time intelligence functions, which do not support years starting on different dates.
While using the 4-4-5 calendar year makes it easy to compare different periods, the mismatch between a 4-4-5 calendar year and the fiscal year of the company might create misunderstandings. Therefore, a possible approach combining both worlds is to use an offset of 52 weeks for any year-over-year comparison. Indeed, by subtracting 364 days (corresponding to 52 weeks) from the selected period, we obtain the same number of days and weekdays in the previous year. This approach does not require an additional 53rd week in a few years because you continue to use the standard Gregorian calendar. However, if computed this way, the value of the previous year does not match the value obtained by looking at the previous year’s value in the Gregorian calendar. With this approach, the range from Jan 1st, 2023 (Sunday) to Dec 31st, 2023 (Sunday) is compared with Jan 2nd, 2022 (Sunday) to Jan 1st, 2023 (Sunday). The same day, Jan 1st, 2023, is present in both periods compared! It seems counterintuitive… but it works!
An example might be helpful at this point. Let us start with the Gregorian calendar. We implement the year-over-year calculation by subtracting 52 weeks with the DATEADD function, which results in an offset of 364 days:
YOY % 52W =
VAR _Current = [# Pageviews]
VAR _Previous = CALCULATE ( [# Pageviews], DATEADD ( 'Date'[Date], -52*7, DAY ) )
VAR _Difference = _Current - _Previous
VAR Result = DIVIDE ( _Difference, _Previous )
RETURN IF ( NOT ISBLANK( _Previous ) && NOT ISBLANK( _Current ), Result )
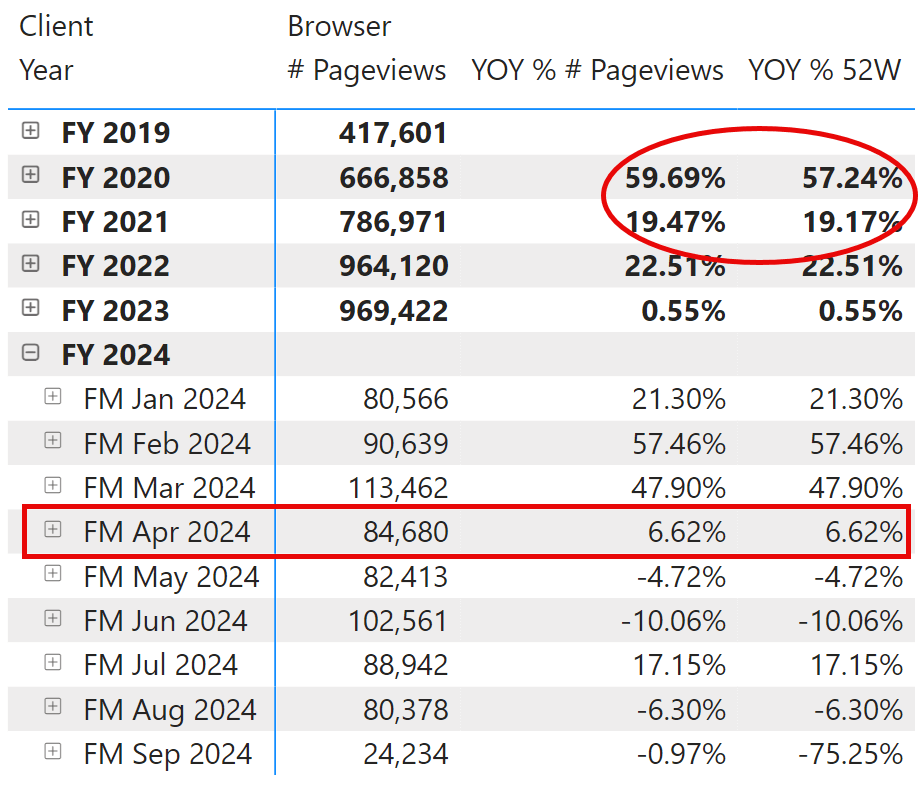
We can compare the two YOY% calculations by using the Gregorian calendar. The YOY% for April 2024 is 8.52%. This is much lower than the 13.45% obtained by comparing April 2024 with April 2023, which have a different number of working days. The YOY % 52W measure uses April 3rd, 2023, to May 2nd, 2023, as a comparison term for April 2024. This way, the current and previous periods start on Monday and end on Tuesday after 30 days, with the same number of weekdays.
The values returned by YOY % 52W are closer to the YOY % computed with the weekly 4-4-5 calendar. However, we cannot compare the two reports because, with a weekly calendar, the starting point (FM April 2024) differs from the calendar month used in the Gregorian calendar. Indeed, if we apply the YOY % 52W measure to the 4-4-5 calendar, we see the same result as the YOY % # Pageviews measure in all years with 52 weeks.
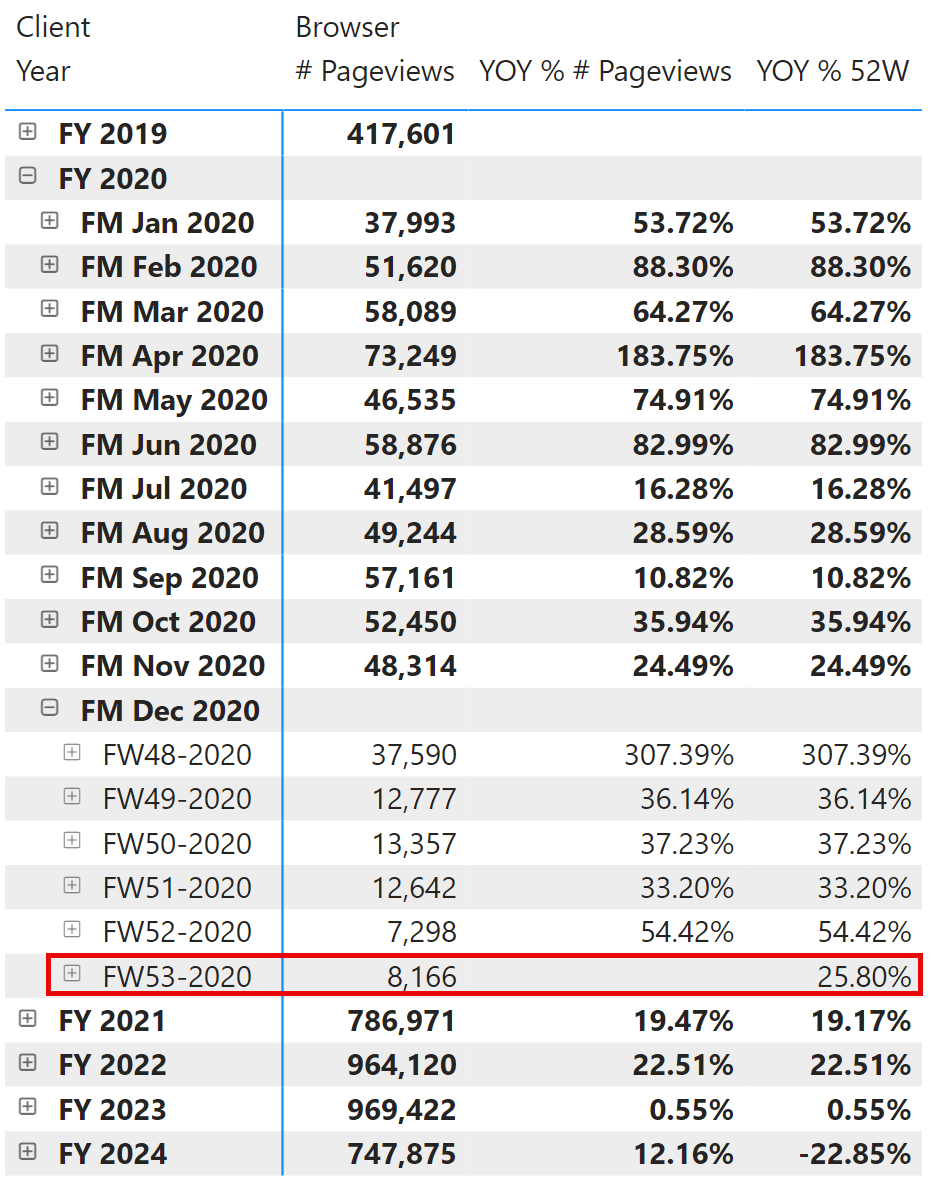
As long as one year has 52 weeks, both ways of performing the comparison will return the same result. However, in FY 2020, we have 53 weeks, which is why there is a difference between the YOY % calculations computed at the year level and all the calculations of the following year (FY 2021) that differ by the additional 53rd week.
If you have a week-based calendar, you might probably prefer to use the time intelligence calculation generated by Bravo. However, the 52-week offset is a convenient technique that can also be used with Gregorian calendars to better compare when it is not required to match the numbers of the accounting books and when a week calendar is unavailable.
Conclusions
Weekly calendars are commonly used in business to compare periods with the same number of working days and weekdays. Power BI does not have direct support for this calendar. Still, you can easily create a week-based calendar with Bravo for Power BI, which also adds the corresponding weekly time intelligence calculations.
A good workaround to get better comparisons when using a Gregorian calendar is the 52-week offset to retrieve the corresponding period. While the numbers used do not match those of accounting books, this approach can be applied to existing semantic models without disrupting existing calculations and reports.
Returns a set of dates in the current selection from the previous year.
SAMEPERIODLASTYEAR ( <Dates> )
Moves the given set of dates by a specified interval.
DATEADD ( <Dates>, <NumberOfIntervals>, <Interval> [, <Extension>] [, <Truncation>] )