One of my readers came to me with an interesting formula to compute in PowerPivot. Even if I don’t normally post about very specific scenarios, I think this time it is interesting to write a blog post since the formula can be easily created, if you think at it in DAX, while it is very hard if you are still approaching it with an MDX or SQL mindset. Thinking in DAX is something that comes after a lot of formula authoring, something that all BI professionals should strive for, as Vertipaq in the new SSAS engine is approaching pretty fast!
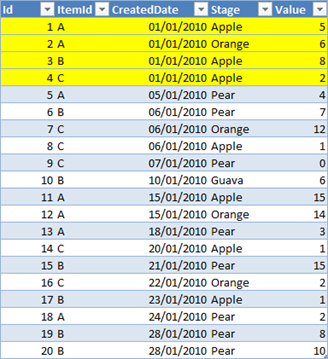
The scenario is pretty simple. A processing capability handles items (A, B, C) and, during the working process, the status of a product changes. Each time a product changes its status a new row is added to a logging table, along with a value, indicating the cost of the transformation. The raw data can be simulated with this table:

You can see, from the highlighted cells, that product A changed its status twice on the first of January, first it became an Apple, and then an Orange (don’t ask me why my reader decided to use fruits to model status, this overcomes my comprehension ![]() but I still find it amusing, so I have not changed it).
but I still find it amusing, so I have not changed it).
Now, with this set of data, the requirement is to compute, at the end of each day, how many products are in a specific status. Thus, product A, at the end of the first of January, was an Orange, even if it has been an Apple for some hourse. Moreover, it should be noted that A keeps the status of Orange during the period from the first to the fifth of January, even if no more rows were added to the table. No new rows, in this case, means “keep the last status”.
When I received the workbook for some testing, it contained two tables: one pretty standard calendar table and the History table, as I have shown it in the previous picture. Moreover, a relationship was holding between the two tables, based on the date.
In such a scenario the relationship is not only incorrect, it is misleading. From the functional point of view, there is no relationship between the fact table and the calendar table. For example, on the second of January, there are no data in the fact table but all of the measures should be computed taking into account the dates before the current one. Thus, the first step I have done is to delete the relationship so that I will leverage DAX only to solve the scenario. PowerPivot will continue to ask you the permission to auto-detect relationships… disable that feature, we know that, in this scenario, we don’t want to leverage automatic relationships.
Now, to solve the scenario we should use a variation of the SCD handling formulas I provided in a previous post. In fact, the table looks very similar to a slowly changing dimension but, this time, we want to compute the last status of a product in a given point in time, where the point in time is not fixed but it changes following the filters imposed by the PivotTable. Said in other words, we are going to compute the SCD status of a product at a variable point in time.
Please stop one second and think twice at what I have said, since this is where “DAX thinking” come to play. In this data model we don’t have a Product dimension, nor we have any canonical SCD handling. Nevertheless, by leveraging the tremendous speed of the Vertipaq engine, we are going to create a sort of “running SCD” on the fly, during the formula computation. This kind of computation is something that you would never try with MDX or SQL, it is a feature that can be leveraged only with DAX, where heavy leaf-level computation is carried on at a blazing speed.
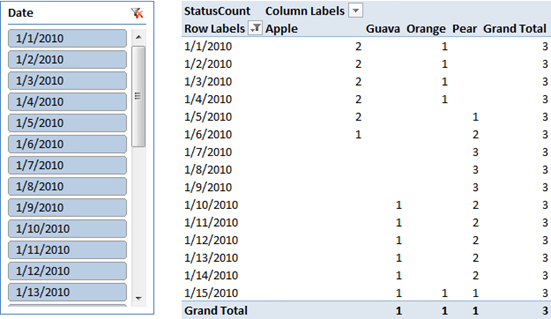
Now, it is time to show the final result and the formula, which I will describe in a few moments:

The result is straightforward: the grand total always shows three products (A, B and C) while the count at the status columns show the number of products that, at the end of that day, are in the given status. You can see that data is shown even for days where no fact table data exists, since the formula will leverage previous information to compute the SCD status at that day.
Now the formula:
1 2 3 4 5 6 7 8 9 10 11 12 13 14 15 16 | =CALCULATE ( COUNTROWS ( FILTER ( HistoryT, HistoryT[Id] = CALCULATE ( MAX ( HistoryT[Id] ), ALL ( HistoryT ), HistoryT[ItemId] = EARLIER ( HistoryT[ItemId] ), HistoryT[ShortDate] <= VALUES ( Dates[Date] ) ) ) ), LASTDATE ( Dates[Date] )) |
Let us spend some words to describe its behavior.
First of all, we use CALCULATE to introduce a filter context that shows, from the calendar table, only the last available date, using LASDTATE. This is useful if the PivotTable does not filter a single date but a range of them (as I am doing with the slicer, that filters only the first fifteen days of the month). In that case, we use the last available date of the selected dates set to perform computation.
Inside that filter context, we use the FILTER function to recreate the SCD status at that date. Let us see how we manage this:
We FILTER the History table removing all the lines that have an ID earlier than the last ID for that specific product, using an inner CALCULATE. Let us check the filters inside the inner CALCULATE:
- ALL(HistoryT) is necessary since in the current filter context, only the products with a specific status are shown. For example, during computation of <1/1/2020, Apple>, only products with “Apple” status are visible, while we want to check if the product has changed status. Thus, the ALL filter removes the condition on the current status, showing all the products.
- HistoryT[ItemId] = EARLIER (HistoryT[ItemId]) filters all the instances of the current product, where “current” means the current iteration of the row context introduced by FILTER.
- HistoryT[ShortDate] <= VALUES (Dates[Date]) filters all the rows that comes before the current calendar table.
Now, it is important to remember that these conditions are ANDed together and the iteration of FILTER produces a table which is, at its end, the current SCD status of the History table at the last date in the calendar selection. It is enough to count the number of rows of this filter to get the number of products that are in the selected status. Always remember that the “selected status” is injected in the inner CALCULATE due to the presence of a filter context on the status which has not been removed by the inner CALCULATE and, thus, it is yet working, filtering only the rows of the SCD that have the correct status.
Working directly with the fact table this formula might not be a top performer for a really huge table, if we need to improve performance, then some more data modeling should be applied, normalizing the product table or performing similar tasks. Nevertheless, what is important to note here is that DAX let you perform very complex computation without any ETL nor modeling, just plain DAX.
If you think at how to solve the same scenario with MDX and… well, I would not even try it, UDM is great but it has a rigid structure and this scenario is not easy to solve without a deep data modeling change. On the other hand, DAX lets you shape the data on the fly and provides a very elegant and neat solution to a complex scenario like this one. The only problem is that, to solve the scenario, you need to think in DAX.
This is just another example of what PowerPivot can do for your reporting needs. If you want to touch the real Karma of PowerPivot, don’t miss the opportunity to follow one of the workshops I and Marco Russo are bringing all over Europe in the next few months.
You can find more info on www.powerpivotworkshop.com. Hope to see you there!
Evaluates an expression in a context modified by filters.
CALCULATE ( <Expression> [, <Filter> [, <Filter> [, … ] ] ] )
Returns a table that has been filtered.
FILTER ( <Table>, <FilterExpression> )
Returns all the rows in a table, or all the values in a column, ignoring any filters that might have been applied.
ALL ( [<TableNameOrColumnName>] [, <ColumnName> [, <ColumnName> [, … ] ] ] )
Returns the value in the column prior to the specified number of table scans (default is 1).
EARLIER ( <ColumnName> [, <Number>] )
When a column name is given, returns a single-column table of unique values. When a table name is given, returns a table with the same columns and all the rows of the table (including duplicates) with the additional blank row caused by an invalid relationship if present.
VALUES ( <TableNameOrColumnName> )
 Copy
Copy Conventions