Browsing on the web I have seen an interesting question that is worth a post, since I think it is a very common pattern and a good example of “thinking in DAX”.
Starting from a table which contains a people and two dates (ActiveFrom, ActiveTo), we want to compute how many days an individual has been active over some period of time, let us say at the month level.
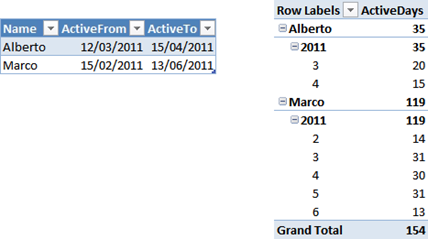
As always, a picture is worth a thousand words, here is the input and the desired result:

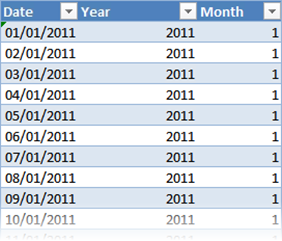
The solution is very easy by means of using a calendar table. To create one, it is enough to create an Excel table like the following one and use “Create Linked Table” from the PowerPivot tab of the Ribbon.

Once linked in PowerPivot, you end up with the two tables, that I called Activities and Calendar. Beware that there is no need at all to create relationships between the two tables, we will solve the scenario using DAX only. Moreover, there is no means to create these relationships, since the dates represent a time period, not singular dates.
To reach the desired result, it is enough to note that, for each record in the Activity table, the number of rows in the calendar table that are between ActiveFrom and ActiveTo, represent the total number of activity days. Thus, the formula is straightforward:
=SUMX ( Activities, CALCULATE ( COUNTROWS (Calendar), Calendar[Date] >= EARLIER (Activities[ActiveFrom]), Calendar[Date] <= EARLIER (Activities[ActiveTo]) ) )
This formula seems to always compute, for each row in the activities table, the total number of active days for the individual, since it does not take into account years and months. Surprisingly, if you write this code in a measure and put it on a PivotTable, you will get the result shown at the beginning.
The reason for which the formula works is that the inner CALCULATE creates a filter on the Calendar[Date] but does not change the current filter context on year and month. Thus, for each cell, the filter on year and month is still active and produces the correct result. Moreover, the same formula work for any calendar period without any change.
I guess for PowerPivot newbies this behavior seems like magic, at least it was so for me a few months ago… in reality, understanding PowerPivot is just a matter of understanding row and filter contexts, once you get them formulas are really simple to write.
An interesting exercise, left to the reader, is to count the number of working days of activity. Easier than you might think and surely worth spending some time if you want to learn some DAX data modeling. ![]()
Returns the sum of an expression evaluated for each row in a table.
SUMX ( <Table>, <Expression> )
Evaluates an expression in a context modified by filters.
CALCULATE ( <Expression> [, <Filter> [, <Filter> [, … ] ] ] )
Counts the number of rows in a table.
COUNTROWS ( [<Table>] )
Returns the value in the column prior to the specified number of table scans (default is 1).
EARLIER ( <ColumnName> [, <Number>] )