One week ago Alberto Ferrari wrote a post about how to do working days calculation in PowerPivot. You might think this is necessary only for accounting department or something like that… but in reality the same techniques are really useful to implement calculations that might be useful when you want to implement some stock analysis using PowerPivot and Excel!
As you might know, in PowerPivot it is important having a Dates table containing all the days, without exceptions. But when you manage stock data, you don’t have values for holidays and probably you have all the stock data into a single table, for all the stocks. If you want to calculate the moving average for each ticker, you need to get always the same number of days with data, without counting days without stock prices.
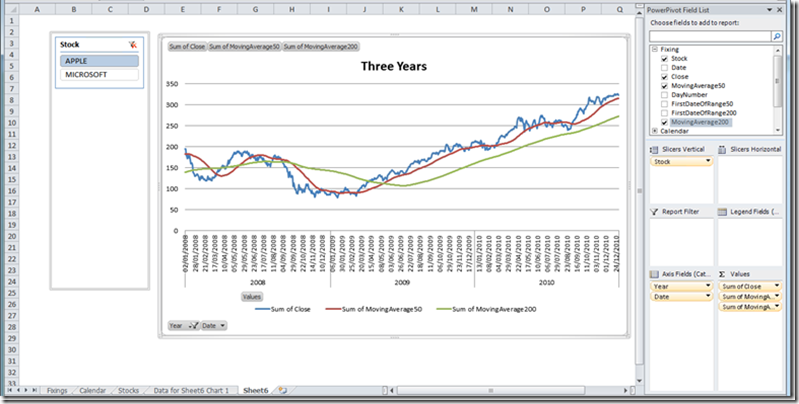
Yesterday Alberto wrote a new post that describes how to calculate the moving average with PowerPivot, which is a useful technique whenever you want to calculate time-based indicators used to generate charts like that:

If you want to know more about PowerPivot, don’t miss the opportunity to follow one of the workshops I and Alberto are bringing all over Europe in the next few months.
You can find more info on www.powerpivotworkshop.com. Hope to see you there!