Microsoft released a new version of Power BI in preview mode, including many new visualizations that are immediately available to all existing subscribers also in production, such as the long waited treemap, combo charts (combining line chart and column chart), and more. These features are available only in HTML5 visualizations, so you can only use the new features online. Microsoft shown these visualizations several times this year (PASS BA Conference in San Jose, and PASS Summit in Seattle), so now this is finally available to anyone. But there is much more!
Power BI Dashboard is a new service, now in public preview (unfortunately only in United States, not sure about which other countries are supported by now, certainly not Europe), that does not require an Office 365 subscription and, more important, provide a design experience on desktop also without having Excel or Office at all. In other words, there is a separate Microsoft Power BI Designer that enables you to:
- Import data with Power Query
- Create relationships between tables
- Create data visualizations with Power View (running the latest HTML5 version locally in a desktop application)
This very first release does not include the full data modeling experience we are used to in Power Pivot, so you cannot create calculated columns or measures, but hopefully this will come in the next updates. In this way, you can use Power BI with a separate “data model” environment that is not tied to Excel. You can have an older version of Excel, or no Excel at all, and still design your data model with the Designer.
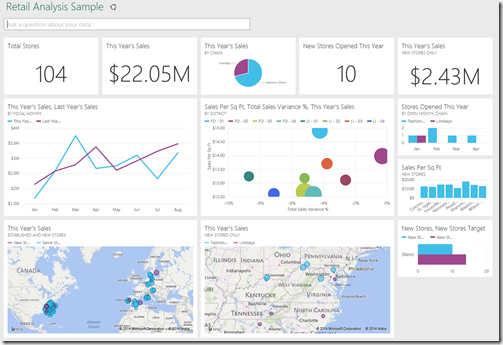
The goal of this app by now is to simply offer an offline design experience, and I have to say that performance of data visualization is very good. With the Designer you design data models and reports. Once published in the Power BI web site, you can “consume” data, but you can also modify the report and “pin” objects to a dashboard, so that you can build your own custom dashboard, such as the Retail Analysis Sample you can see below.

You can create datasets getting data from several SaaS applications, such as Dynamics CRM, Salesforce, GitHub, ZenDesk, SendGrid, and Marketo. You can also connect to live Analysis Services through a new gateway named Power BI Analysis Services Connector and use new native mobile apps for Power BI. Support for iPad should be already available (again, depending on countries, it seems not available in Europe by now). Future support for iPhone and Windows tablets has been already announced.
This is a very interesting evolution of the Power BI platform and I look forward to use it with real data and real users! Many tutorial videos are available on YouTube.