We all have biases. Personally, I kick myself whenever I identify that I have applied my biases when doing an evaluation of any kind. Unfortunately, this happens often because I work with numbers every day.
Do you think we at SQLBI have any idea what the most popular topics and articles are? Of course, we know what they are because we measure this. And yet, they usually are completely different from our initial “gut feeling”. The most popular topic is not something you would for example find in the frequently asked questions.
You would think MDX is dead, and yet the downloads of MDX Studio prove you wrong. Yes, MDX might be on its way out, but it has a long way to go before retiring.
![]() You would think that DAX drives most of the traffic on sqlbi.com – and yes, DAX is what we are known for – yet the most popular download on our website is the Power BI Visual Reference (yes, we need to update it, it’s in our to-do list!).
You would think that DAX drives most of the traffic on sqlbi.com – and yes, DAX is what we are known for – yet the most popular download on our website is the Power BI Visual Reference (yes, we need to update it, it’s in our to-do list!).
 You would think people do not work over the weekend because they are not using DAX Formatter, but you will find them on YouTube binging on videos about… DAX!
I could go on for hours. I hope you get the point.
Every single time I think I have an answer, the data proves me wrong.
This is the beauty of business intelligence – or data analytics, or data science, feel free to use your favorite definition here. It is useful to understand the world and to make better decisions. Just accept that you might be wrong; actually, I am usually wrong, but remaining optimistic that I might sometimes get it right is how I feel better about myself.
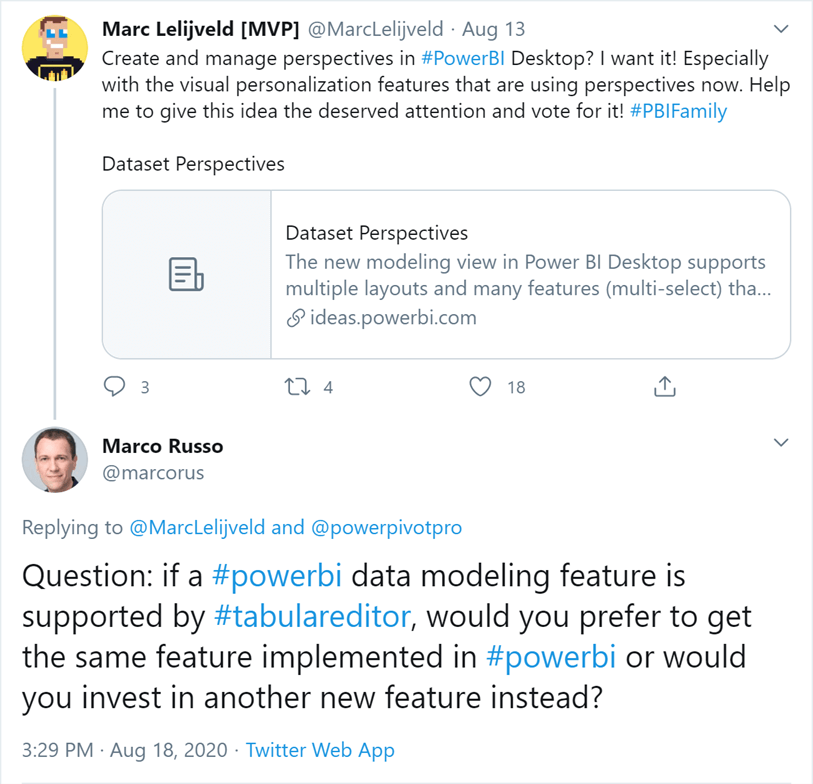
This week, I saw a discussion about the need to bring into Power BI a data modeling feature currently available only by using Tabular Editor.
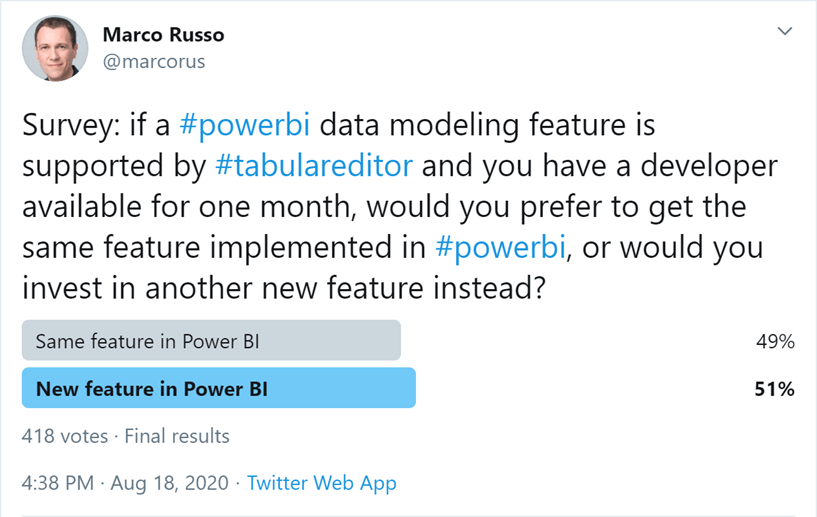
I immediately received many replies of people saying that the feature should be implemented in the product because many companies cannot rely on third party tools. Without entering into the discussion – about the difference between data modeling features only for developers and supported features for the report consuming experience – I was surprised by the small number of comments in favor of new features. So I published a survey. I received an amazing number of votes. I had never received more than 200 likes for a single tweet before, but this time I got more than 400 votes in 24 hours. The result was the same after only 100 votes, though.
What surprised me is that the opinion of the people who wanted the same feature in Power BI was louder on Twitter, but the survey was saying something different. My reading of the data is that any decision makes 50% of the people unhappy.
At this point, I received a few tweets saying that the numbers are biased because I was asking people who follow me on Twitter. But… It is the same audience that was saying they want the feature in Power BI! I was not trying to make the ultimate survey about this important decision – which is in the hands of Microsoft product managers, not me. I was just trying to get some numbers, and the most important number was the number of votes in 24 hours: 400 people. This topic is hot!
I wanted to share this because I often witness an unfortunate reaction when the numbers do not confirm our biases. Denial, different interpretation, invalidation of the numbers, biased audience, you name it. This happens everywhere, at any level, for any kind of decision. Believe me, I have seen big companies make big mistakes even though the numbers were telling them loud and clear they were about to do the wrong thing.
If you are reading this blog, analyzing data is probably your job or an important part of your professional life. Please, do not make this mistake. A number is a number. Numbers don’t lie. More often than not, the number is not what you expected. I feel your pain. It is hard to accept. I felt this pain every single time, and I do not particularly enjoy it. However, you have to get over it.
If you are reading this blog, you like learning. I love learning. When I see a number I don’t like, instead of thinking about my pride, I think I am learning something new. I get excited instead of dwelling in disappointment, and I can start thinking about the meaning of that number. I formulate a hypothesis, and then I look for numbers that can validate it. The process continues. But I am just learning something new.
—
I know, you want to know what I picked. I want “New feature in Power BI”. But I did not vote on my own survey!

