UPDATE 2021-03-11: A new technique has been published in this article: Filtering the top products alongside the other products in Power BI. We suggest you read it for a better solution.
UPDATE 2023-04-10:Fixed typo in sample code renaming “Other” to “Others” to keep consistency with the published demo.
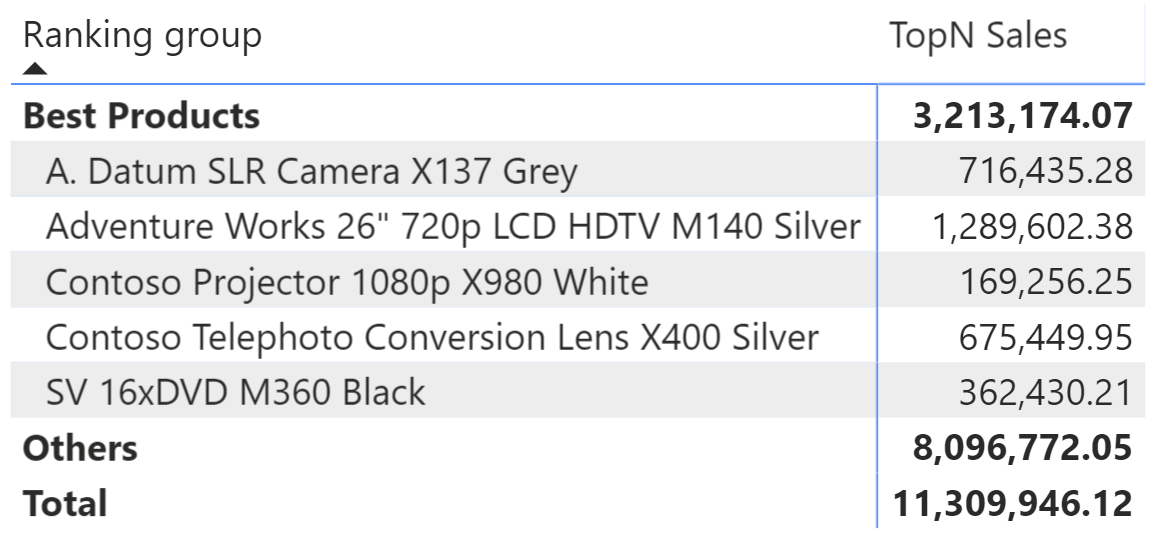
Power BI offers the ability to apply a Top N constraint in a visual level filter, so that only a certain number of items are visible based on the evaluation of a measure. A common requirement is to show an additional row that accumulates the “other” items, which are those that are not visible in the report like in the following figure.

In order to solve this scenario you cannot use the Top N filter of Power BI. Instead, you apply the filter in a special measure (TopN Sales) and you use a calculated table to accommodate for the additional row named Other. Moreover, you need an additional column to let the Other row appear at the bottom of the table.
First, you cannot use the Product[Product Name] column in the report, because you need an additional value (Other) that is not present in the Product Name column. Therefore, you need a calculated table that contains all the values of the Product Name column, plus the additional value, “Other”. We named this table Product Ranking.
Product Ranking =
UNION (
    SELECTCOLUMNS (
        ALLNOBLANKROW ( 'Product'[Product Name] ),
        "Ranking name", 'Product'[Product Name],
        "Ranking group", "Best Products"
    ),
    { ( "Others", "Others" ) }
)
The calculated table also contains a Ranking group column, which has only two values: Best Products and Other. This column is useful as the first level of the hierarchy in the matrix, grouping the Best Products at the beginning and showing the Other row at the end.
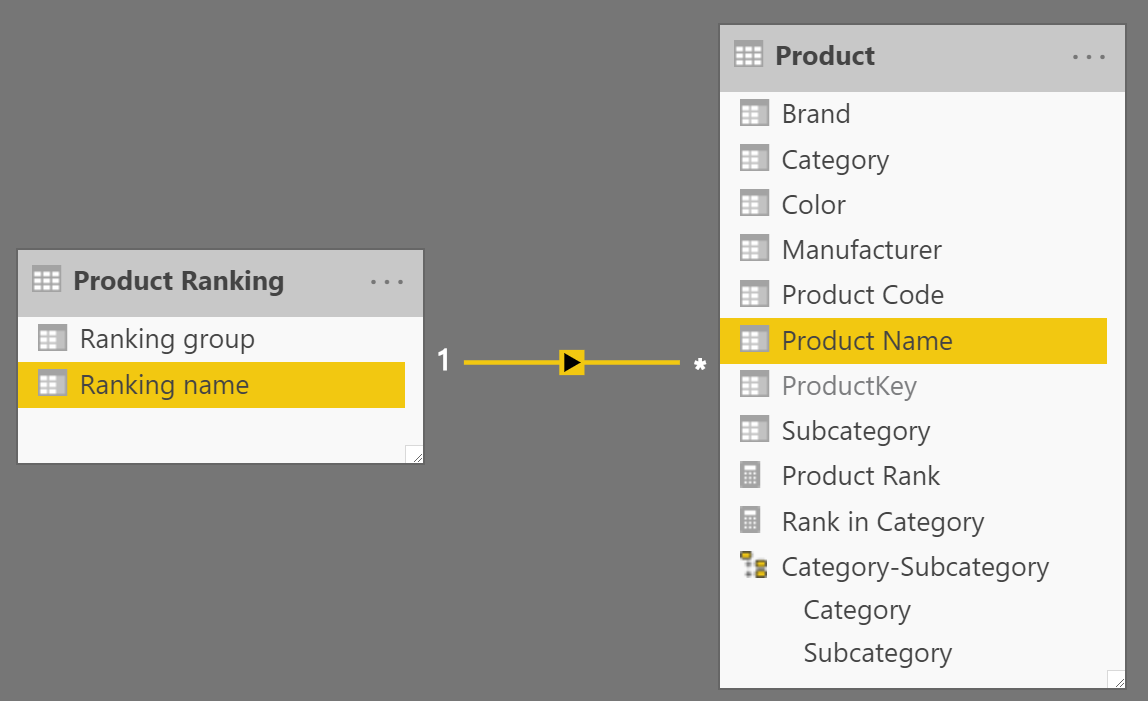
Then, you must build a relationship between ‘Product Ranking’[Ranking Name] and the Product table. Beware that – by default – Power BI might create this relationship as a 1:1 bidirectional relationship, which would be wrong for our purposes. You need a standard one-to-many relationship, with the Product Ranking table on the one-side of the relationship.

The Ranking name column can be used to filter the products by name. It also contains the additional value, “Other”, which is not linked to any real product. The following formula reads the filter present on the Product Ranking table and uses it to show the desired value in the matrix:
TopN Sales :=
IF (
    ISINSCOPE ( 'Product Ranking'[Ranking group] ),
    VAR NumOfProducts = 5
    VAR RankingGroup =
        SELECTEDVALUE ( 'Product Ranking'[Ranking group] )
    VAR TopProducts =
        TOPN ( NumOfProducts, ALLSELECTED ( 'Product Ranking' ), [Sales Amount] )
    RETURN
        SWITCH (
            RankingGroup,
            "Best Products",
                CALCULATE ( [Sales Amount], KEEPFILTERS ( TopProducts ) ),
            "Others",
                IF (
                    NOT ISINSCOPE ( 'Product Ranking'[Ranking Name] ),
                    VAR TopAmount =
                        CALCULATE ( [Sales Amount], TopProducts )
                    VAR AllAmount =
                        CALCULATE ( [Sales Amount], ALLSELECTED ( 'Product Ranking' ) )
                    VAR OtherAmt = AllAmount - TopAmount
                    RETURN
                        OtherAmt
                )
        ),
    [Sales Amount]
)
The code is designed to show the value corresponding to the remaining products in the Other row of the Ranking Group column. This way we reduce the number of rows of the report, still showing the relevant information. If needed, you can customize the number of products by changing the value of the NumOfProducts variable or you can let the user select the number of items to display through a slicer, as shown in the second page of the report available for download.

In order to keep the “Other” row at the bottom, it is necessary to sort the Ranking group alphabetically. Otherwise sorting the data by the sales amount could show the Other row at the beginning if its value is larger than the total of Best Products. Currently, we do not have a solid workaround for this problem.
 Marco Russo & Alberto Ferrari