-
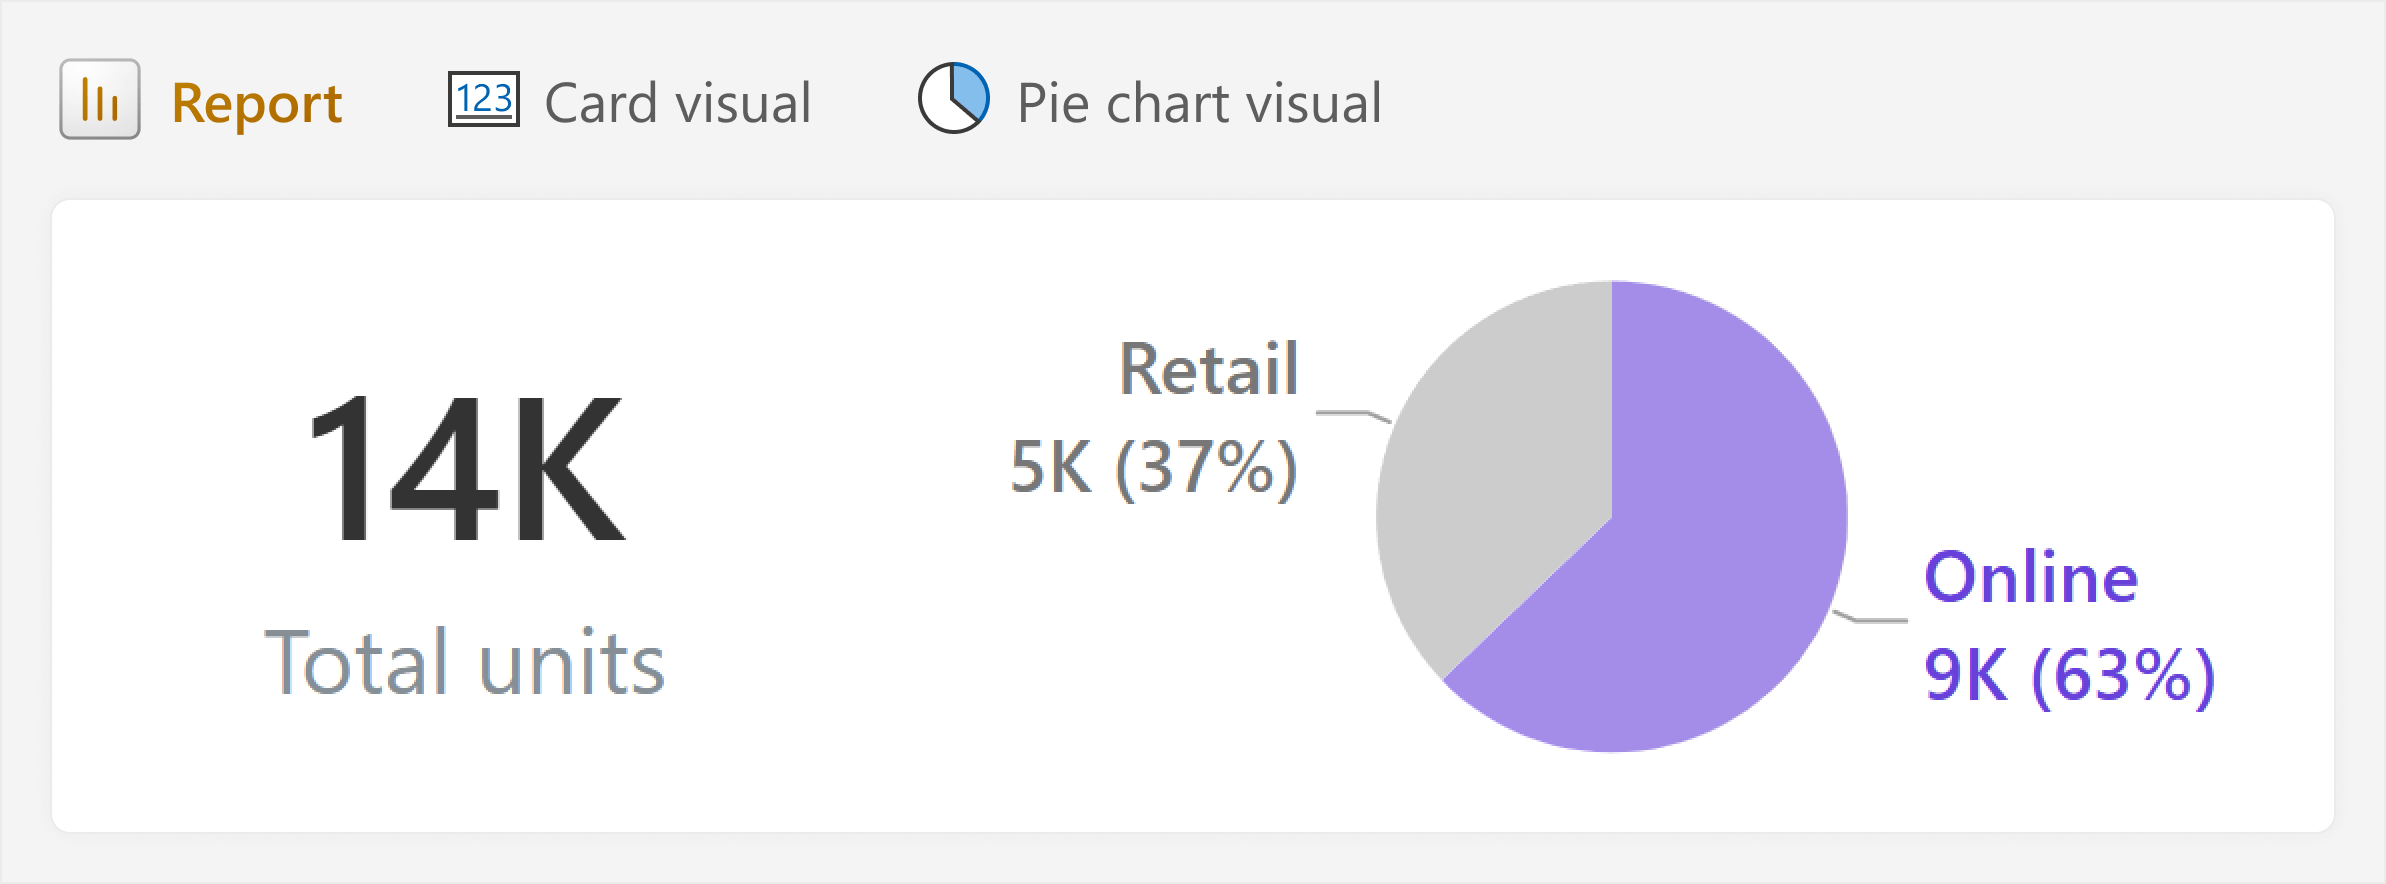
This article is about how rules like “avoid pie charts” can be useful for beginners, but also unhelpful in real-world scenarios with more nuance. Instead of learning rules about “how”, try to understand the “why”. Read more
-
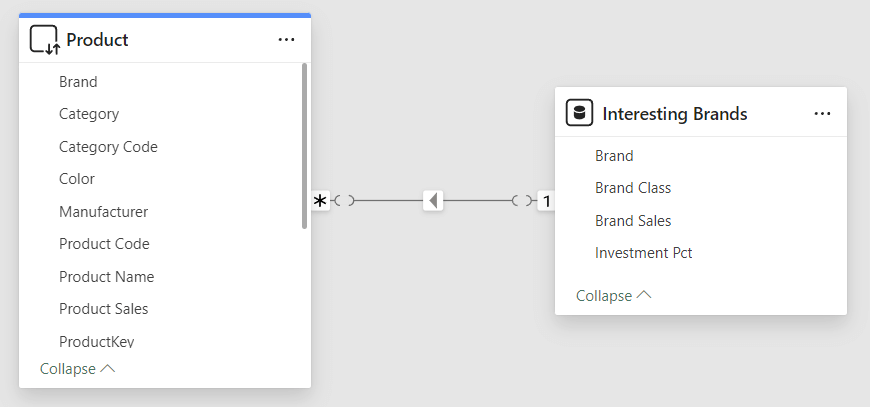
This article describes the differences between the ALL and CROSSFILTERED functions in DAX. Read more
-
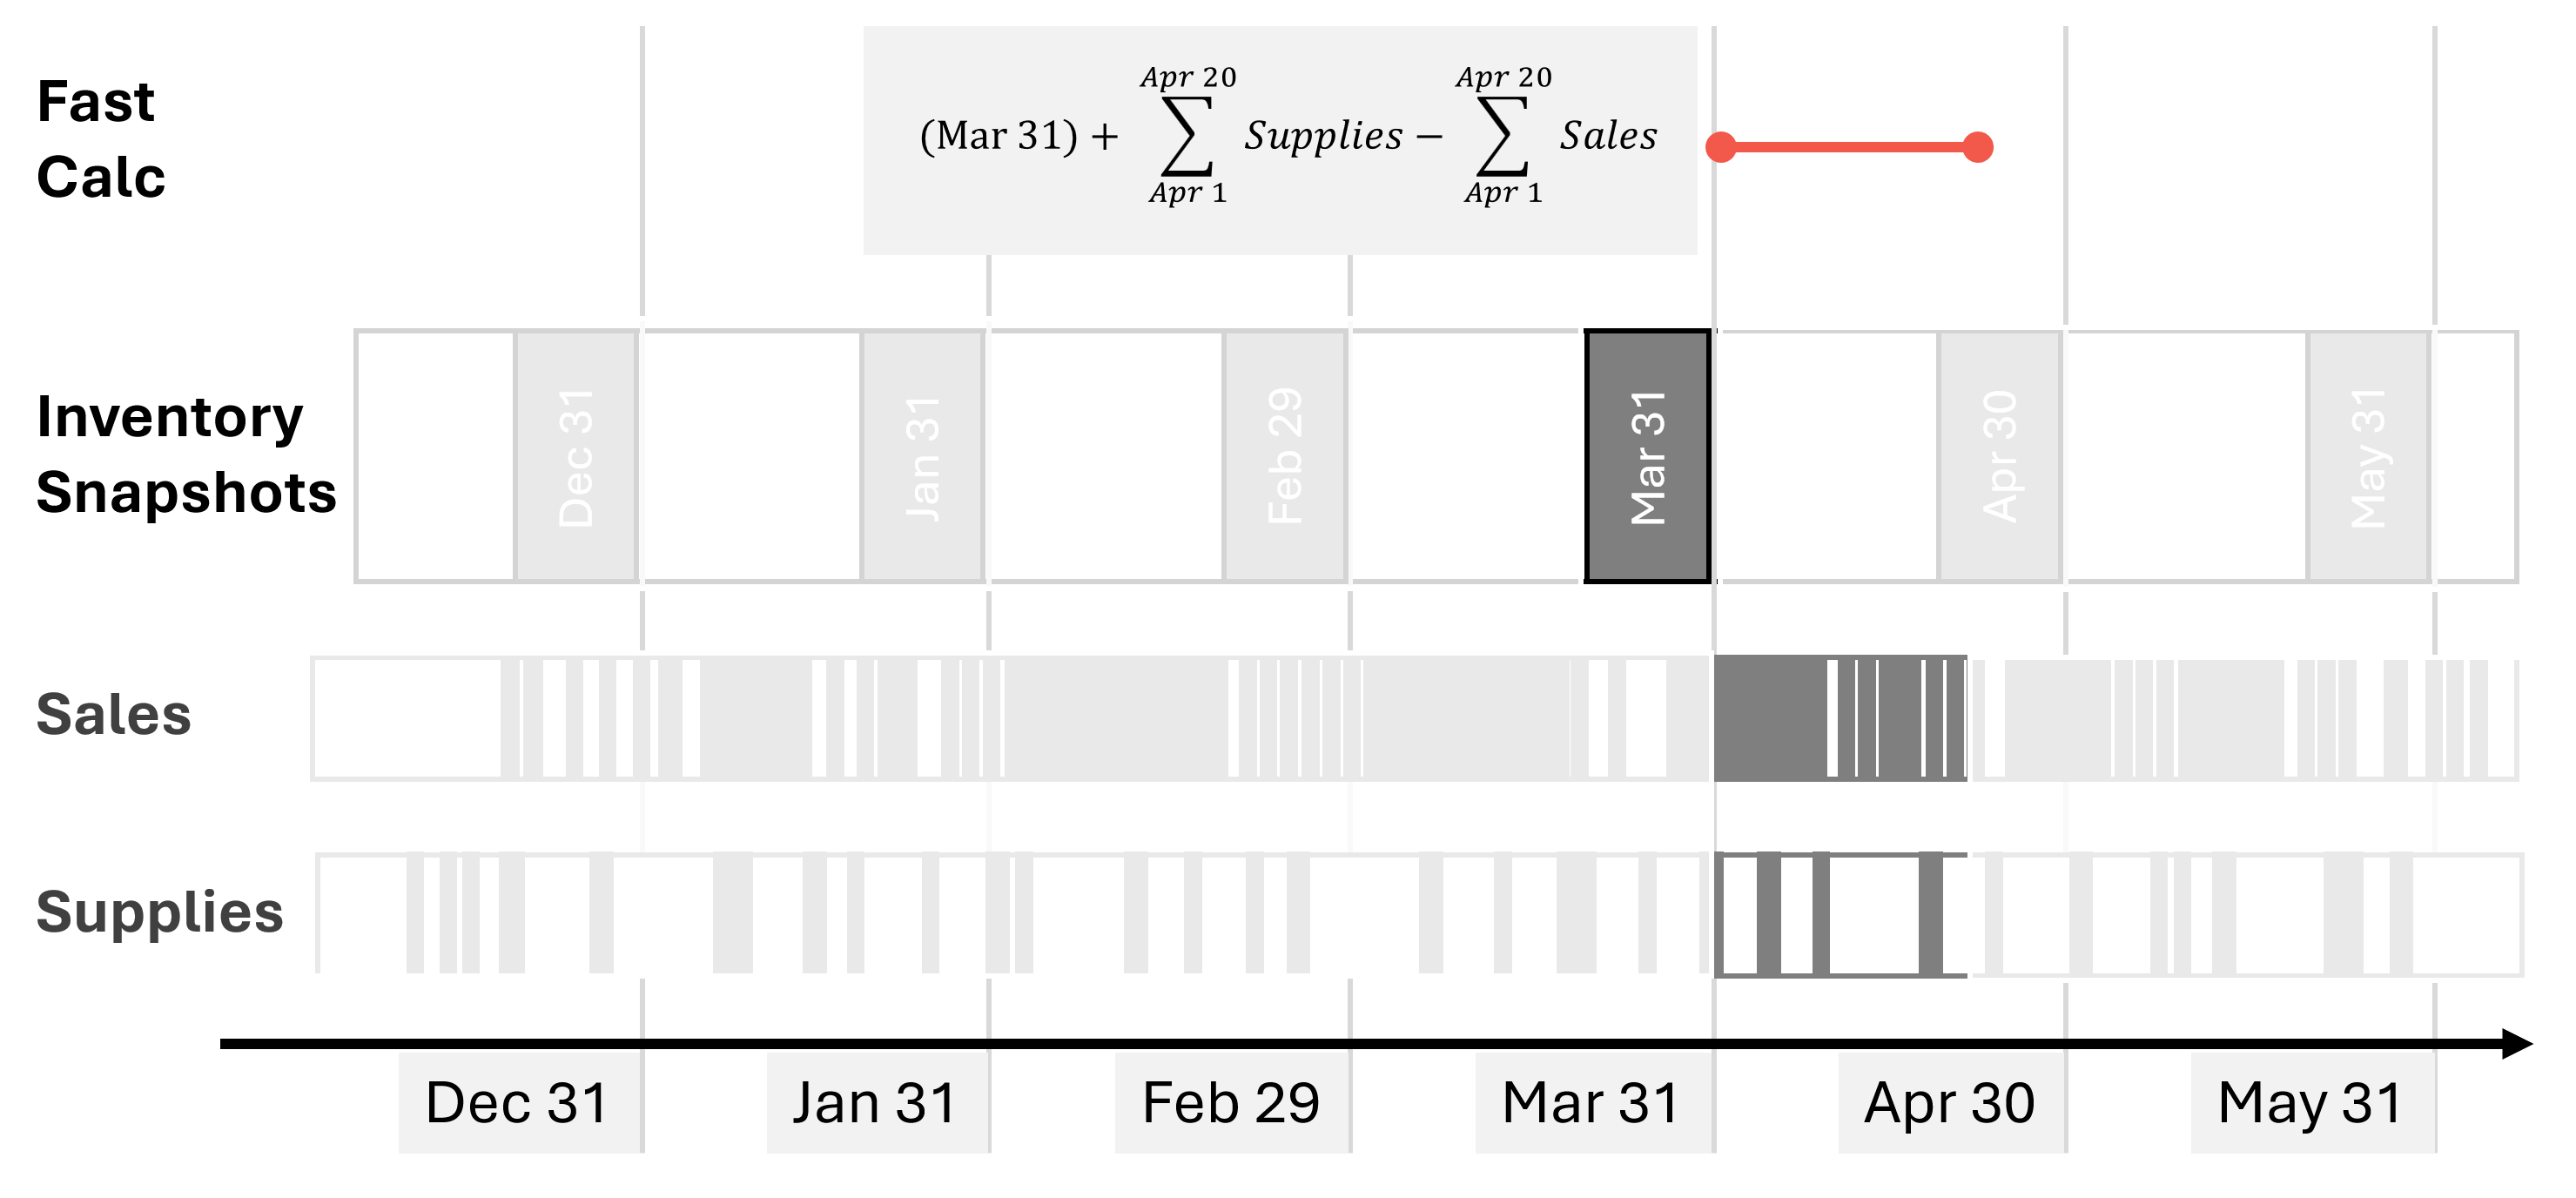
This article describes how to optimize inventory calculations in DAX by using snapshots to avoid the computational cost of a complete running total. Read more
-

After another year, it is time to recap what happened in the DAX and SQLBI worlds and provide a few spoilers about 2025! Read more
-
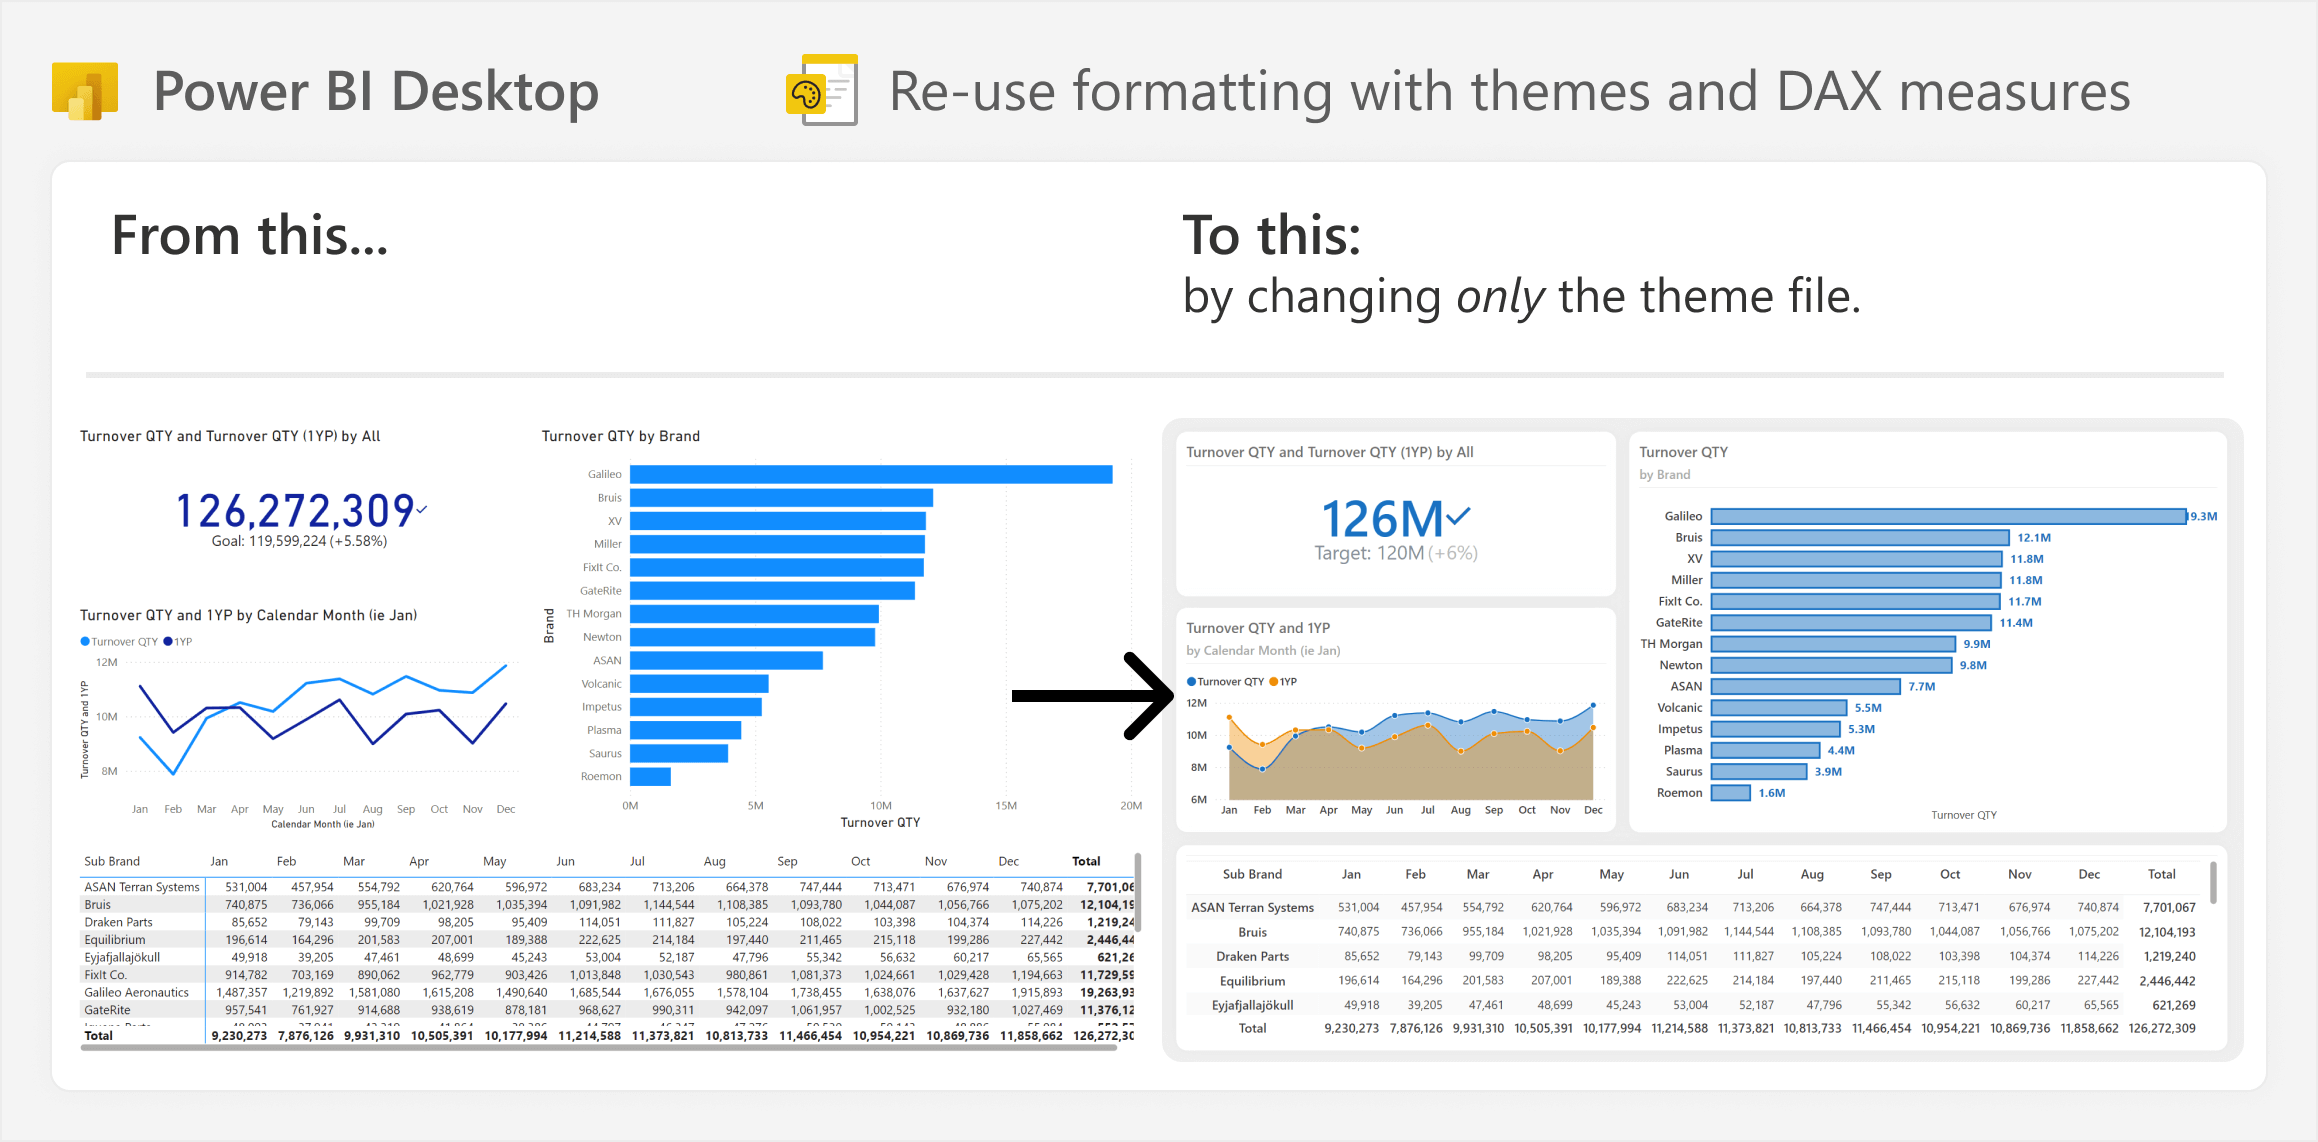
This article is about how you can save time when building and maintaining Power BI reports by using strategies to re-use visual formatting. Read more
-

We released more content in SQLBI+ with two new sessions: Introducing Visual Calculations in Power BI: This two-hour session introduces the Visual Calculations feature in Power BI, which is still in preview. We plan to update the “Understanding Visual Calculations… Read more
-
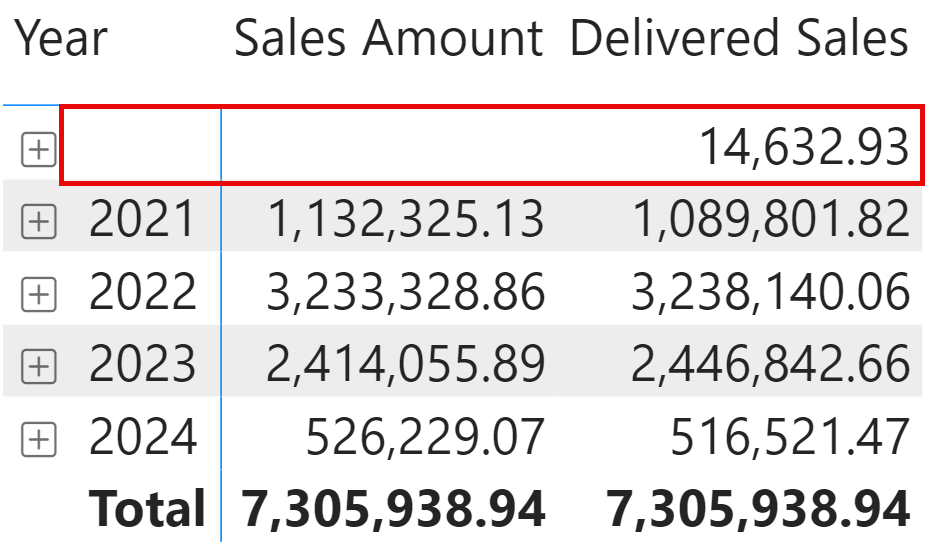
This article explores the implications of having blank values in date columns and provides the best practices for managing them in DAX calculations and Power BI reports. Read more
-

No, this is not the end-of-the-year blog post about what happened in 2024: There is still more than one month to go! However, we are receiving many requests asking what we are working on at SQLBI. I wanted to write… Read more
-
In the mass of announcements made at Microsoft Ignite, I want to mention the SQL database in Fabric, which finally closes a gap we had in Power BI for many years. In May 2022, Microsoft launched Power BI Datamarts in… Read more
-
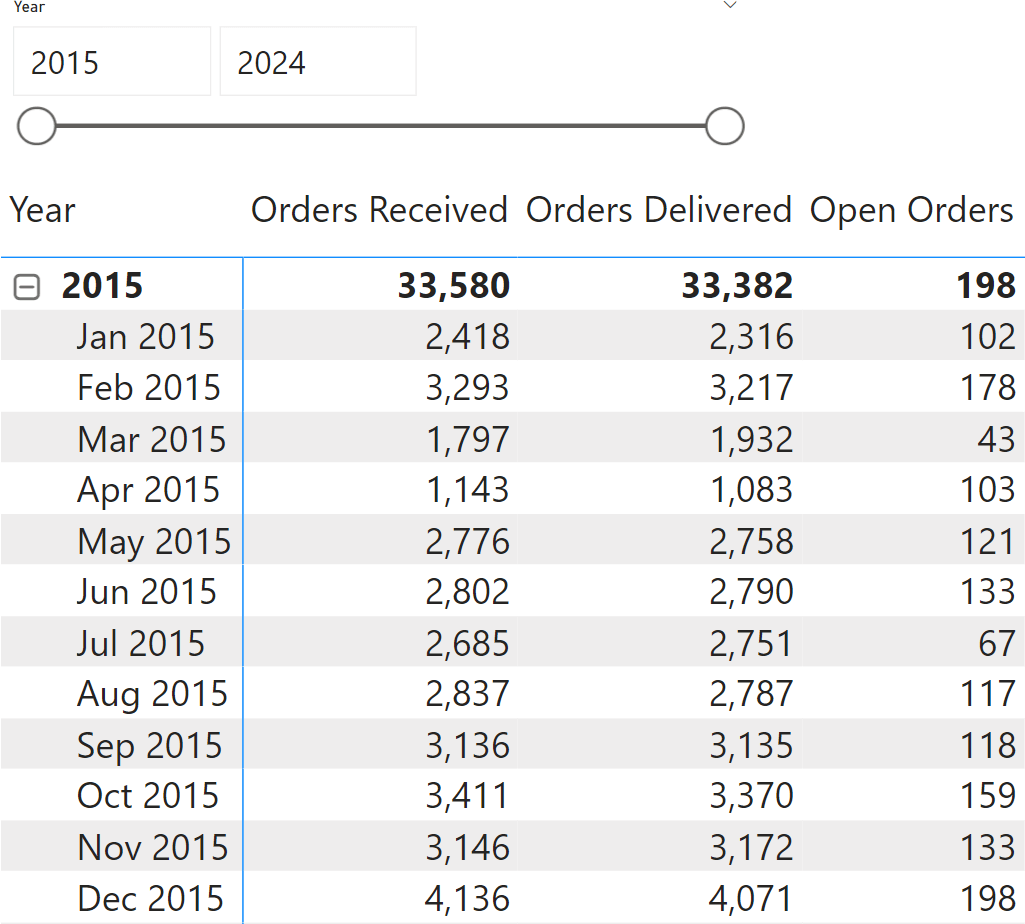
This article describes the use of visual calculations for a scenario where they may be particularly relevant: computing open orders at the end of a time period. Read more