NEW ARTICLE
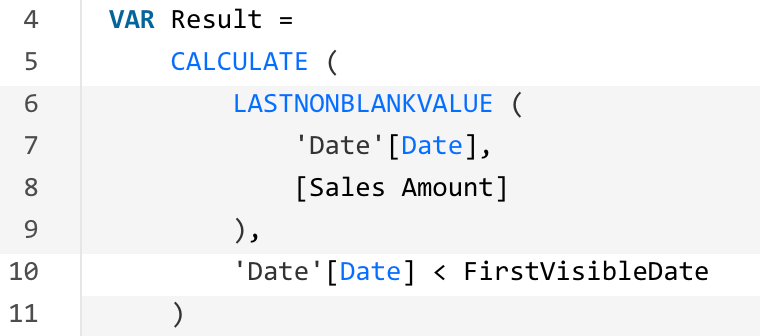
This article explains the behavior of LASTNONBLANK, LASTNONBLANKVALUE, and similar DAX functions, also providing patterns for performance optimization.
Read more
Analyzing performance of LASTNONBLANK


NEW POST
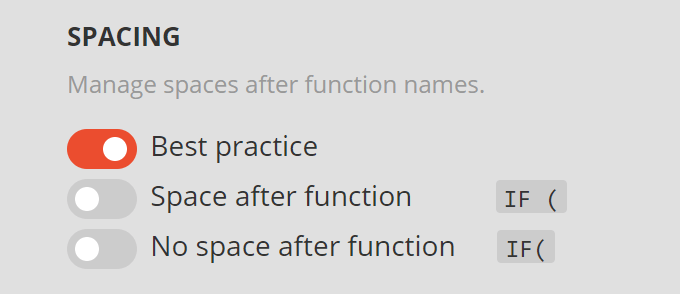
DAX Formatter offers a new option to control the spacing after functions. Should this be the new best practice? The discussion is open.
Read more
New spacing options


LEARNING
Courses highlights
Reserve your seat in San Francisco or Charlotte for the upcoming DAX courses!

  San Francisco (Mar 11-13) Offer expiring!

  Charlotte (Mar 24-26)


BI-WEEKLY NEWS DIGEST
Latest news
• Power BI Report Server January 2020 feature summary
While we wait for the first new release of Power BI Desktop in 2020, Microsoft has released an update to Power BI Report Server. The features seems pretty much aligned with what we had in November/December 2019 in Power BI online.
Jan 27,2020 · Microsoft
• Announcing: Improved report usage metrics in modern workspaces
Microsoft released a new usage report for Power BI. Because this is a true dataset, you can also use Analyze in Excel to create custom reports over Power BI usage. Yes, your Power BI usage report in Excel: why not?
Jan 27,2020 · Microsoft
• Sending Power BI alerts to users via Teams using Power Automate and Adaptive Cards
Chris Webb shows us how to send Power BI alerts via Microsoft Teams. Remember, Power Automate is not a brand new product. It is the new name of Microsoft Flow!
Jan 27,2020 · Chris Webb
• Composite models over Power BI and Analysis Services datasets
Microsoft quietly announced the ultimate feature of semantic models: you will be able to create a Power BI model with a live connection to Analysis Services or to a Power BI dataset, and to add other tables such as your precious Excel worksheet. This is the Holy Grail that BI users had been awaiting for decades. Public preview is planned for August 2020. An excruciating, 7-month home stretch after years of secret dreams.
Dec 17,2019 · Microsoft
• Visualizing Power Query Diagnostics Data in a Power BI Decomposition Tree
The new diagnostic functionality in Power Query provides a large amount of data that could be hard to analyze. Chris Webb suggests how to display the result of a diagnostic query using the Power BI decomposition tree visual. This is a work in progress, but it is worth taking a look at if you are dealing with slower Power Query transformations.
Feb 3,2020 · Chris Webb

DAX Guide