Topic: Modeling
-
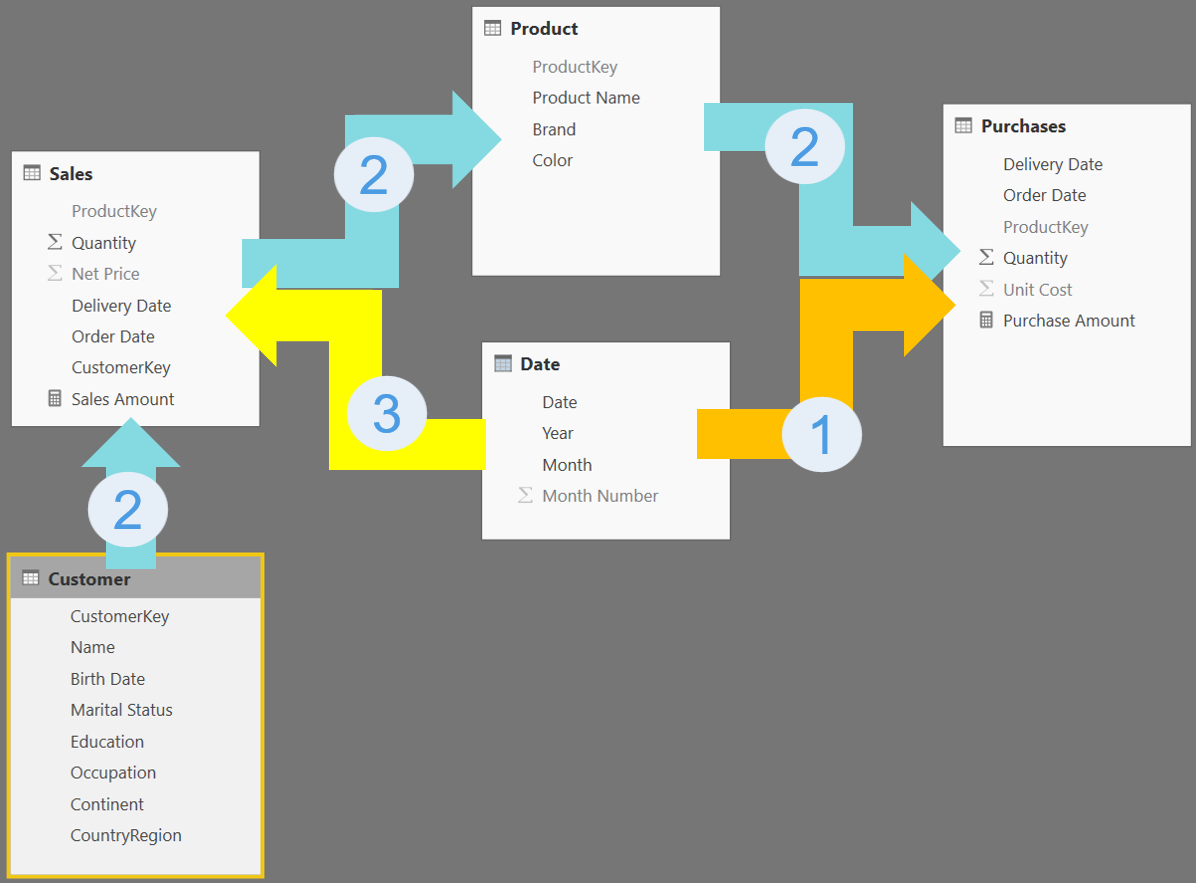
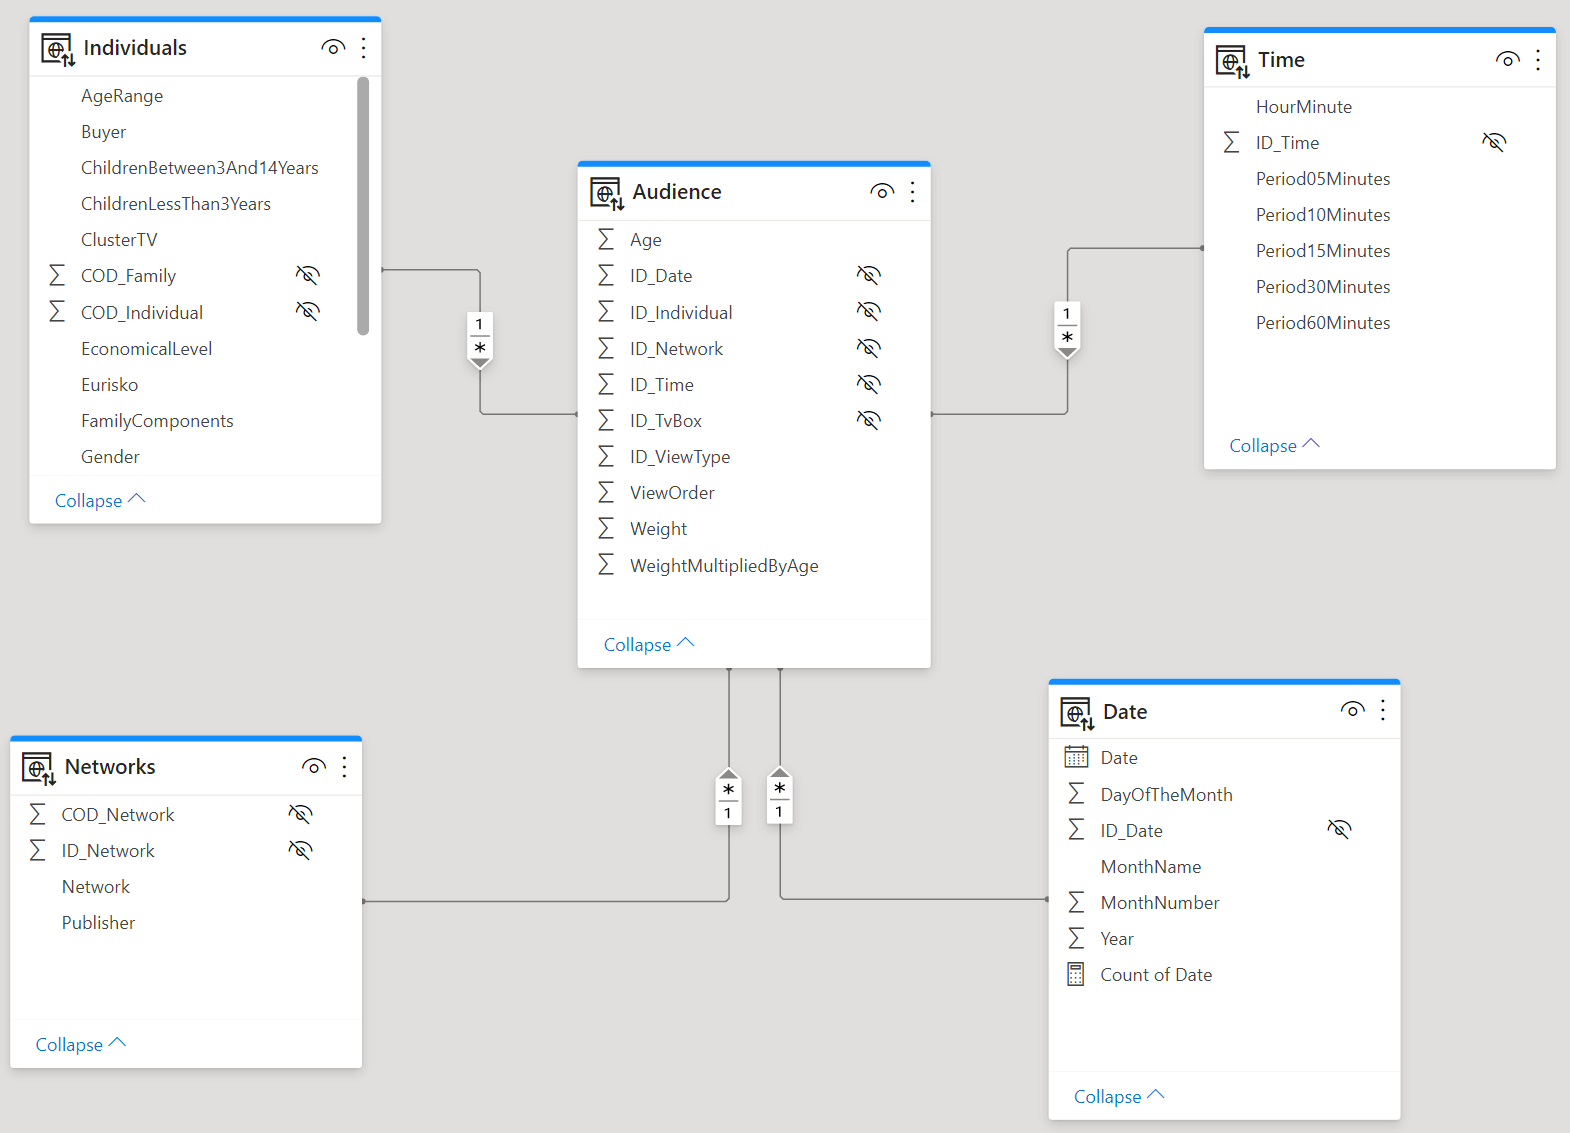
Activating bidirectional cross-filter in a Tabular data model might create ambiguous paths in the chain of relationships, resulting in very dangerous models as numbers become unpredictable. This article provides a deep explanation of the kind of ambiguity that might appear… Read more
-
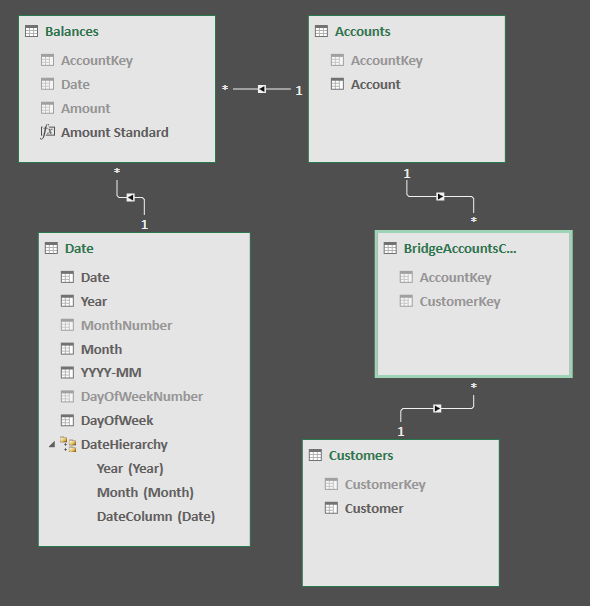
The new DAX available in Excel 2016 and the data model in Power BI and Analysis Services 2016 offer tools to manage many-to-many relationships in a more efficient way than previous version, as described in this article. Read more
-
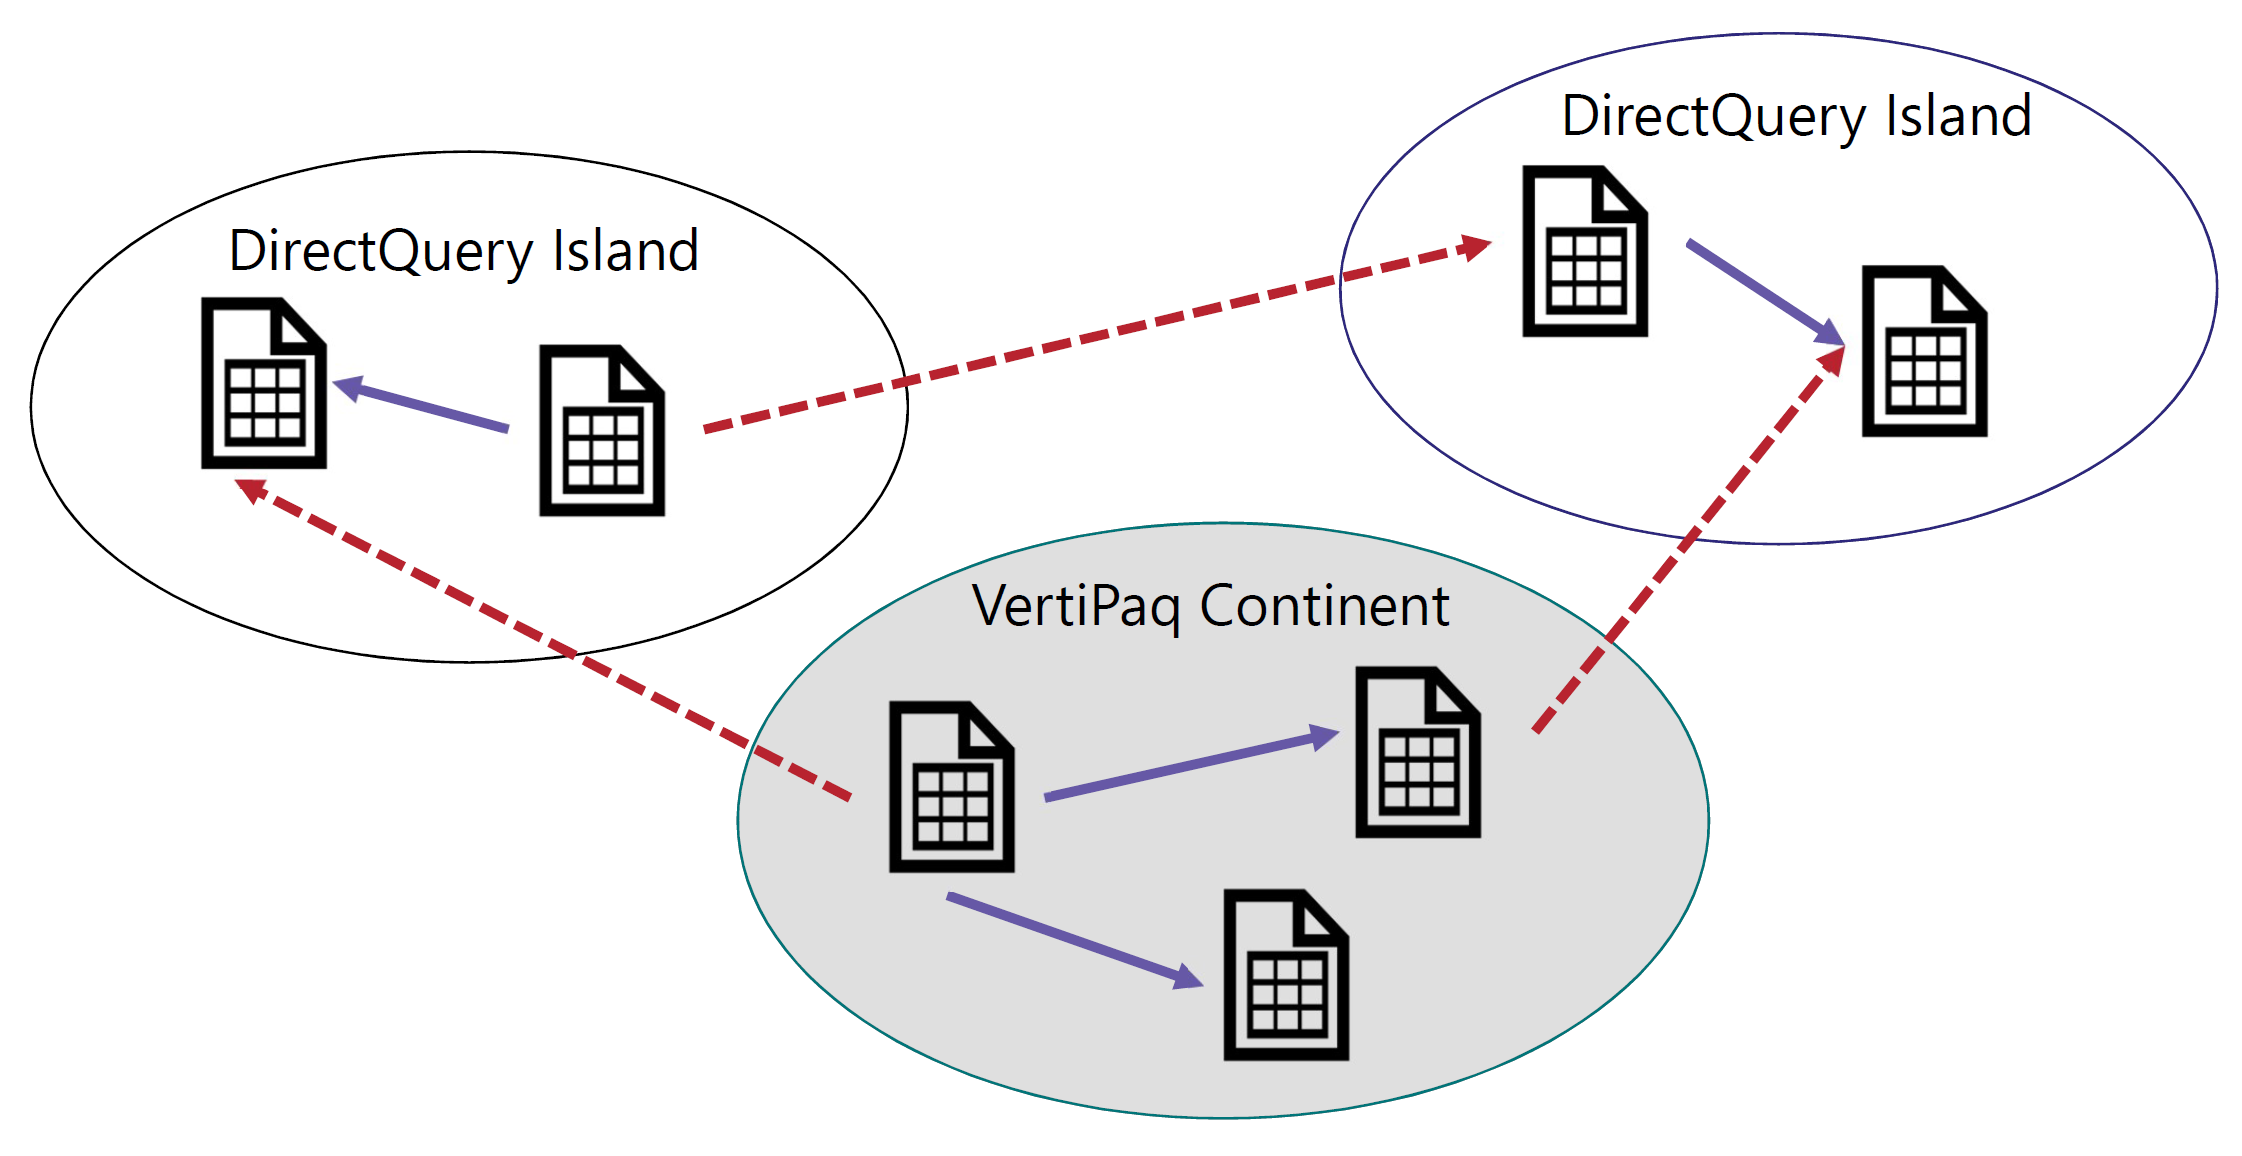
This article describes what limited relationships are and the differences between regular and limited relationship in Power BI and DAX. Read more
-
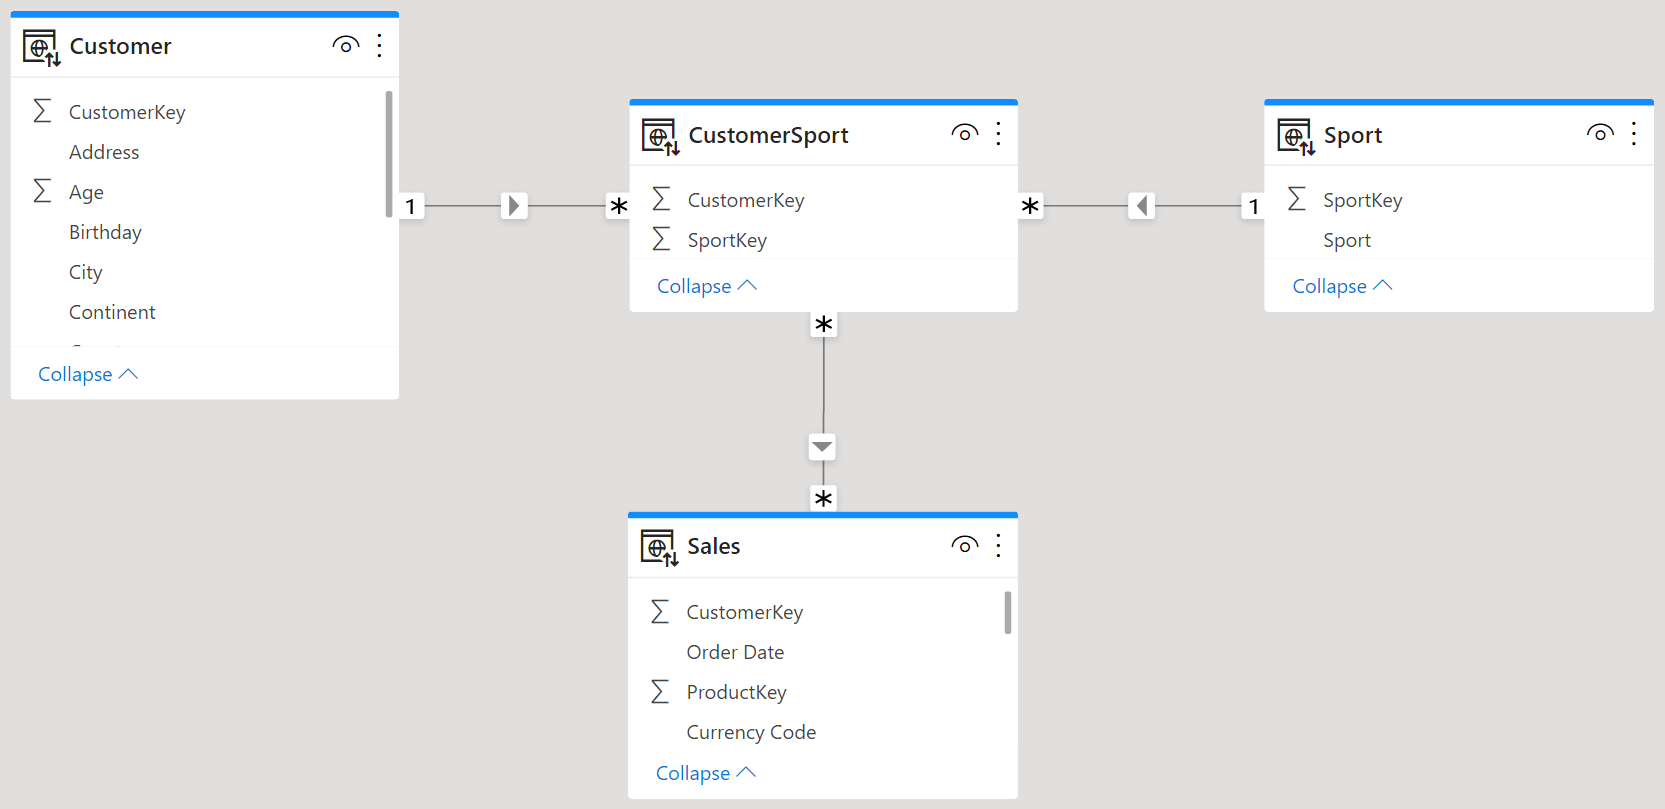
There are two options to model many-to-many relationships using Tabular and Power BI: you can use either a regular bidirectional filter relationship, or a limited unidirectional relationship. In this article, we compare the performance of both options. Read more
-
This article describes the types of relationships available in Power BI and Analysis Services, clarifying the differences in cardinality and filter propagation of physical relationships. Read more
-
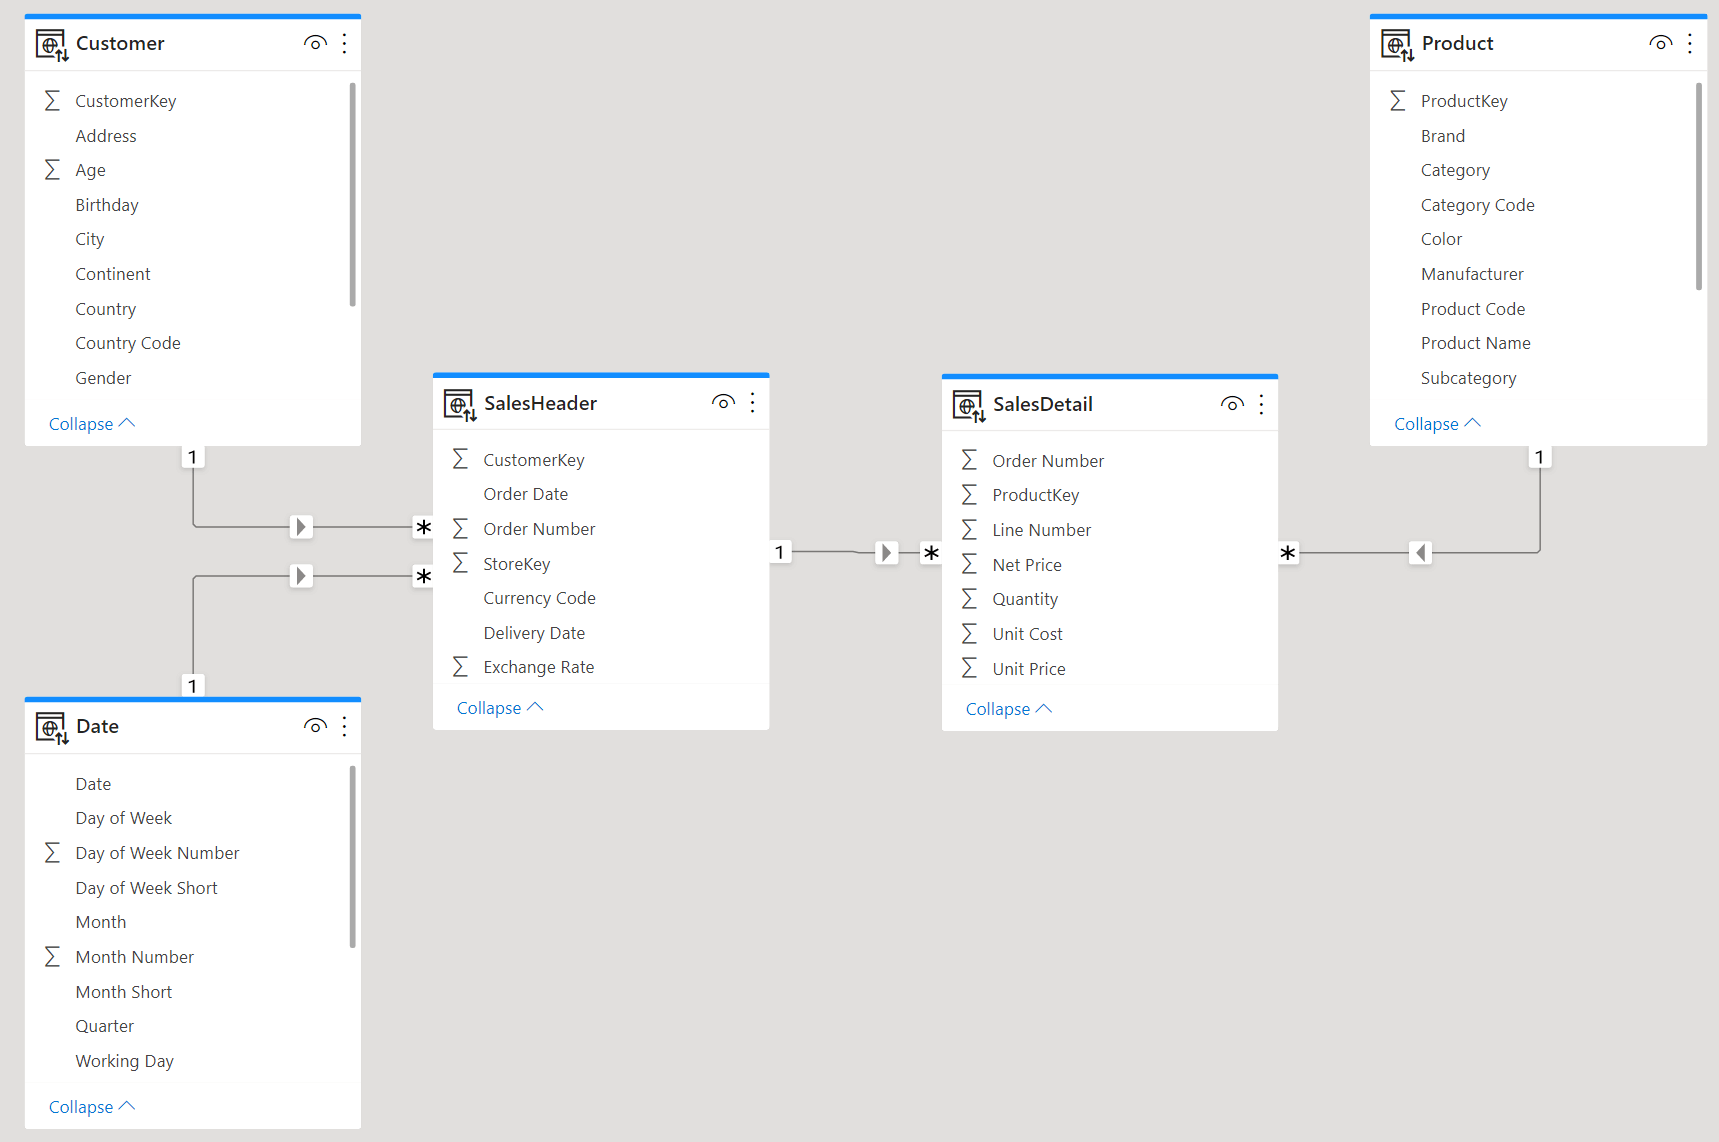
In this article we perform a performance comparison between header/detail models and star schemas. Building a star schema might require a few ETL steps and some coding. Nonetheless, it is always the best modeling option. Read more
-
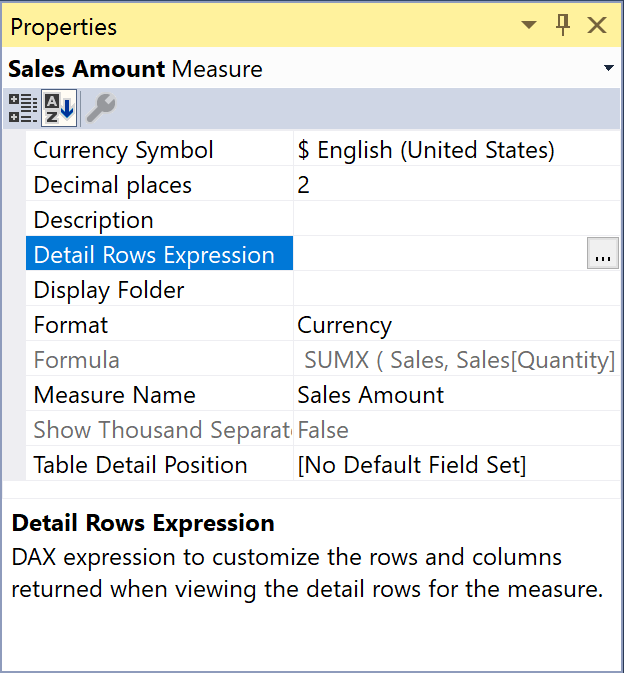
The Detail Rows Expression in a Tabular model provides the user with control over the drillthrough results obtained by showing details of a measure. This article describes typical DAX expressions you can use in this property. Read more
-
This article analyzes a classic modeling question: is it better to build a model as a regular star schema or as a single table in Power BI? The answer is clear: a star schema is always the best choice. Read more
-
This article explains the most common causes of the error, “A circular dependency was detected” in Power BI and Analysis Services. Read more
-
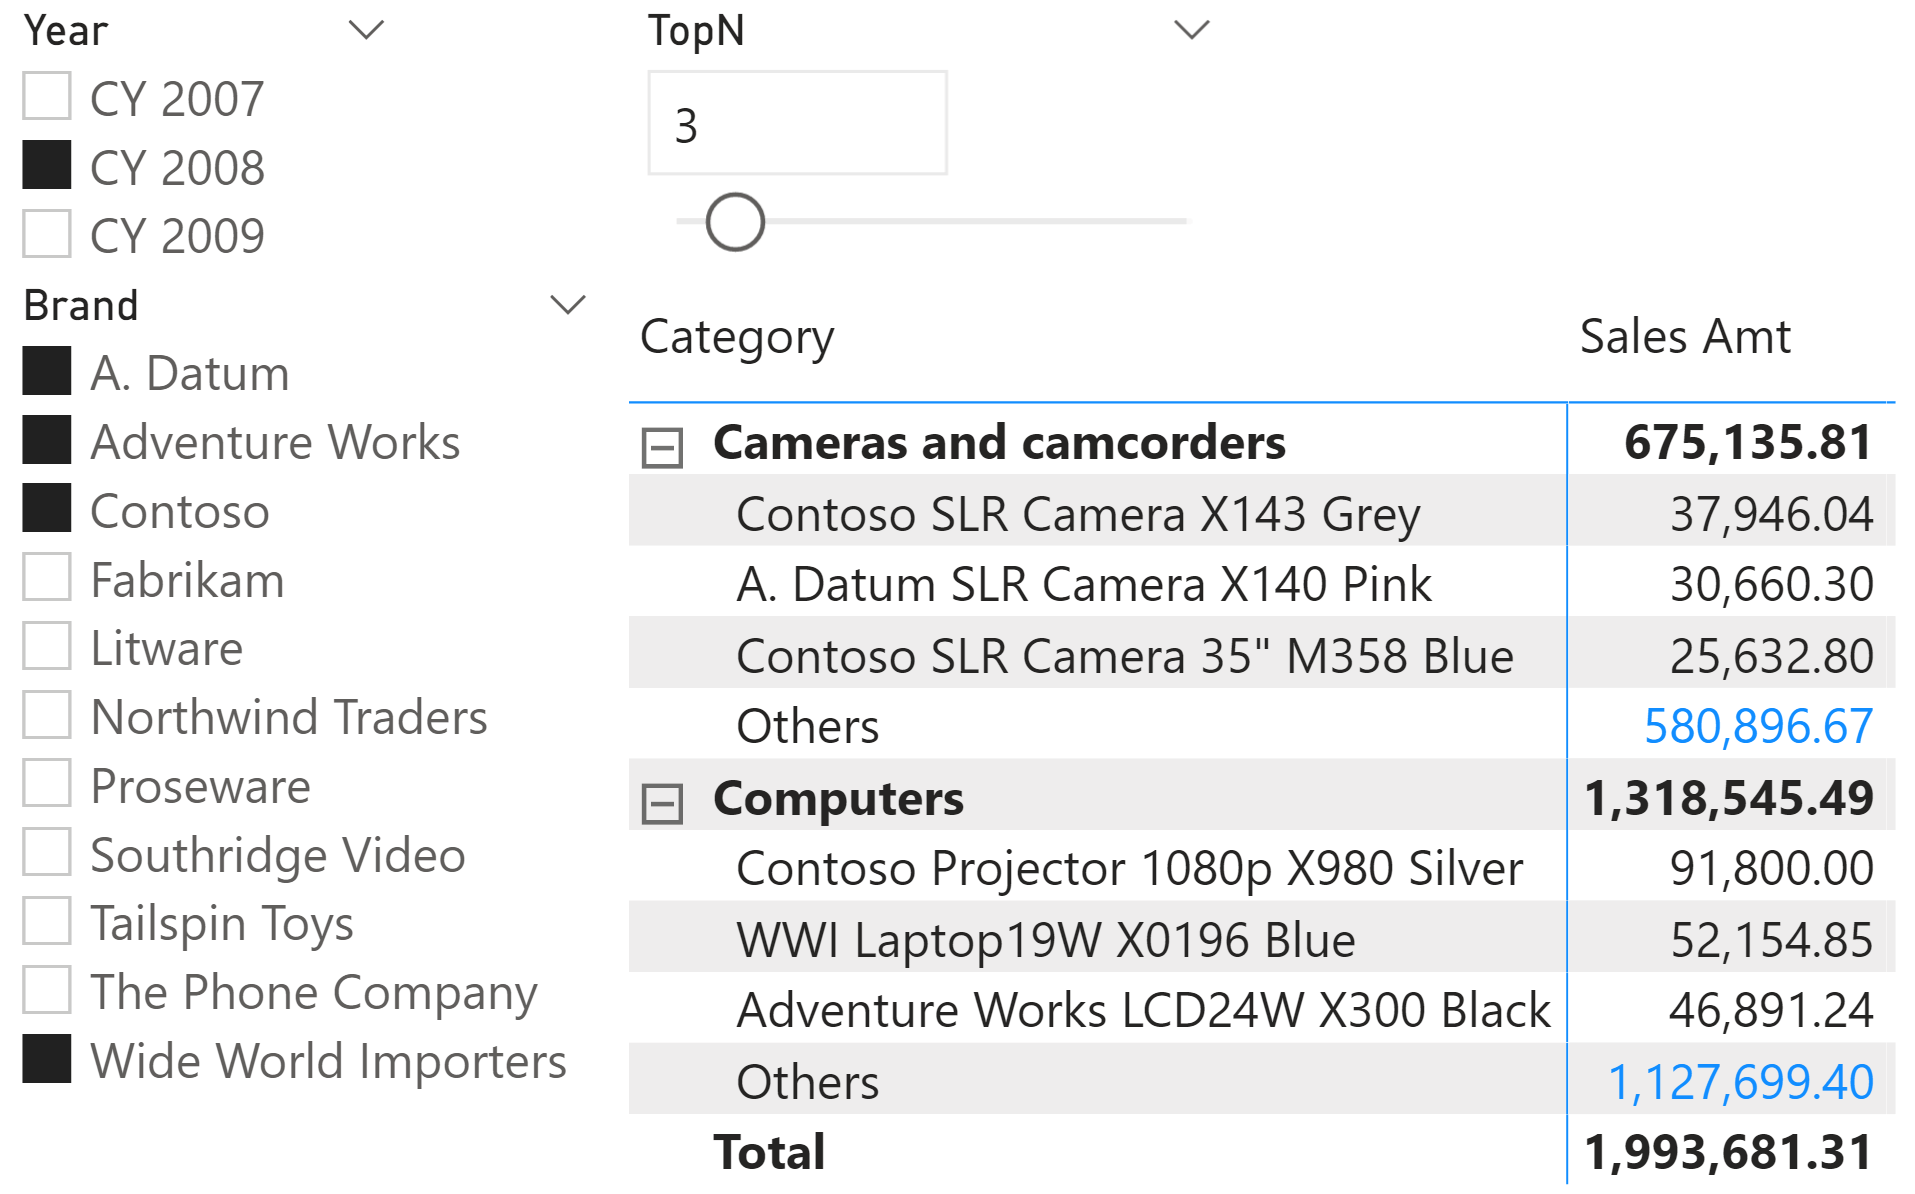
This article shows an optimized DAX technique to display the first N products for each category in Power BI, adding a row that aggregates the value for all the other products. The companion video introduces the scenario and the general… Read more
