Topic: Power BI
-
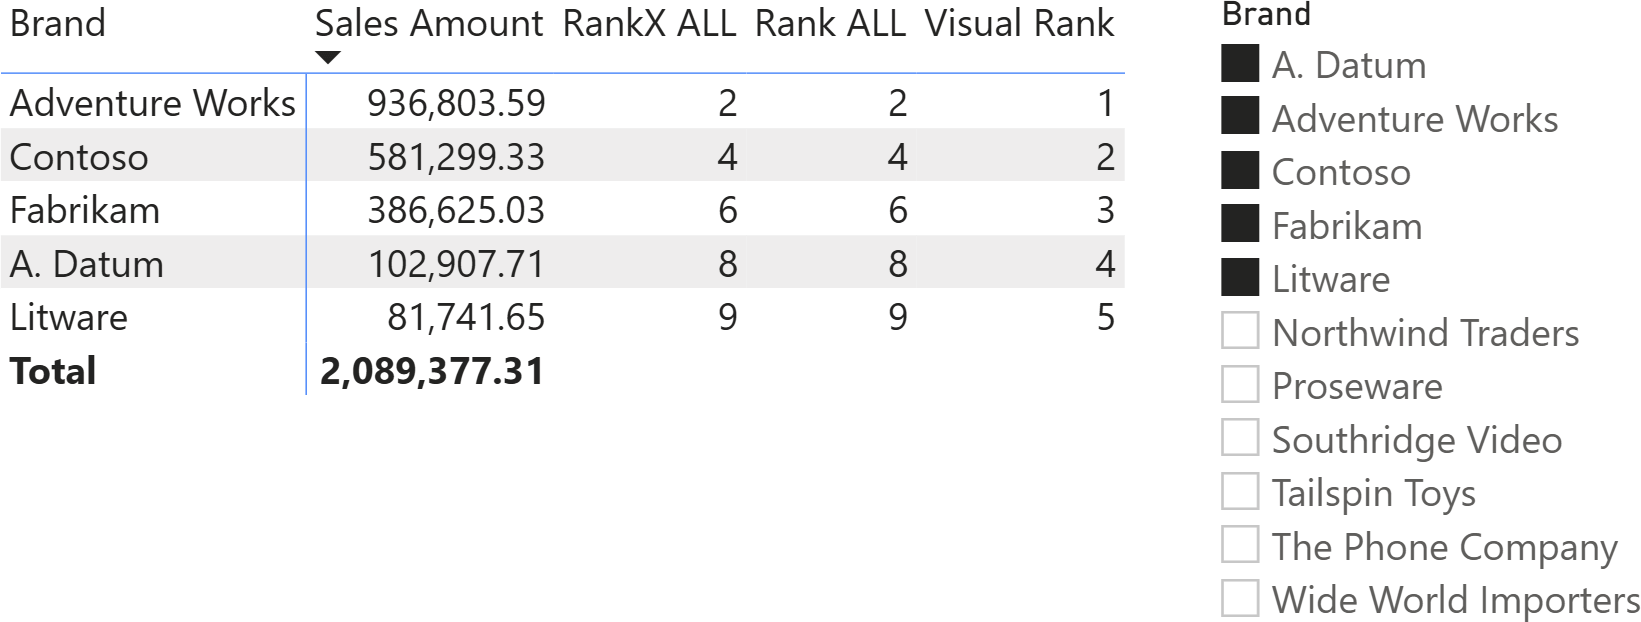
Should you use RANK or stick with RANKX? In which scenarios is one better than the other? This article provides an in-depth analysis to help readers make informed choices. Read more
-
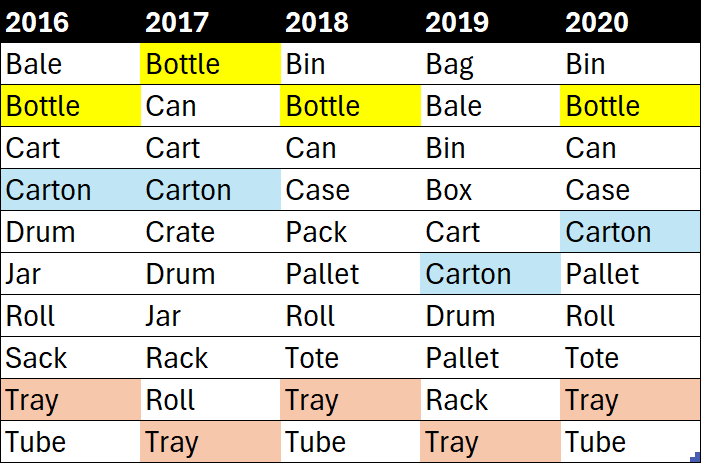
This article outlines the process of creating a measure to identify the top 10 products by sales each year. Read more
-
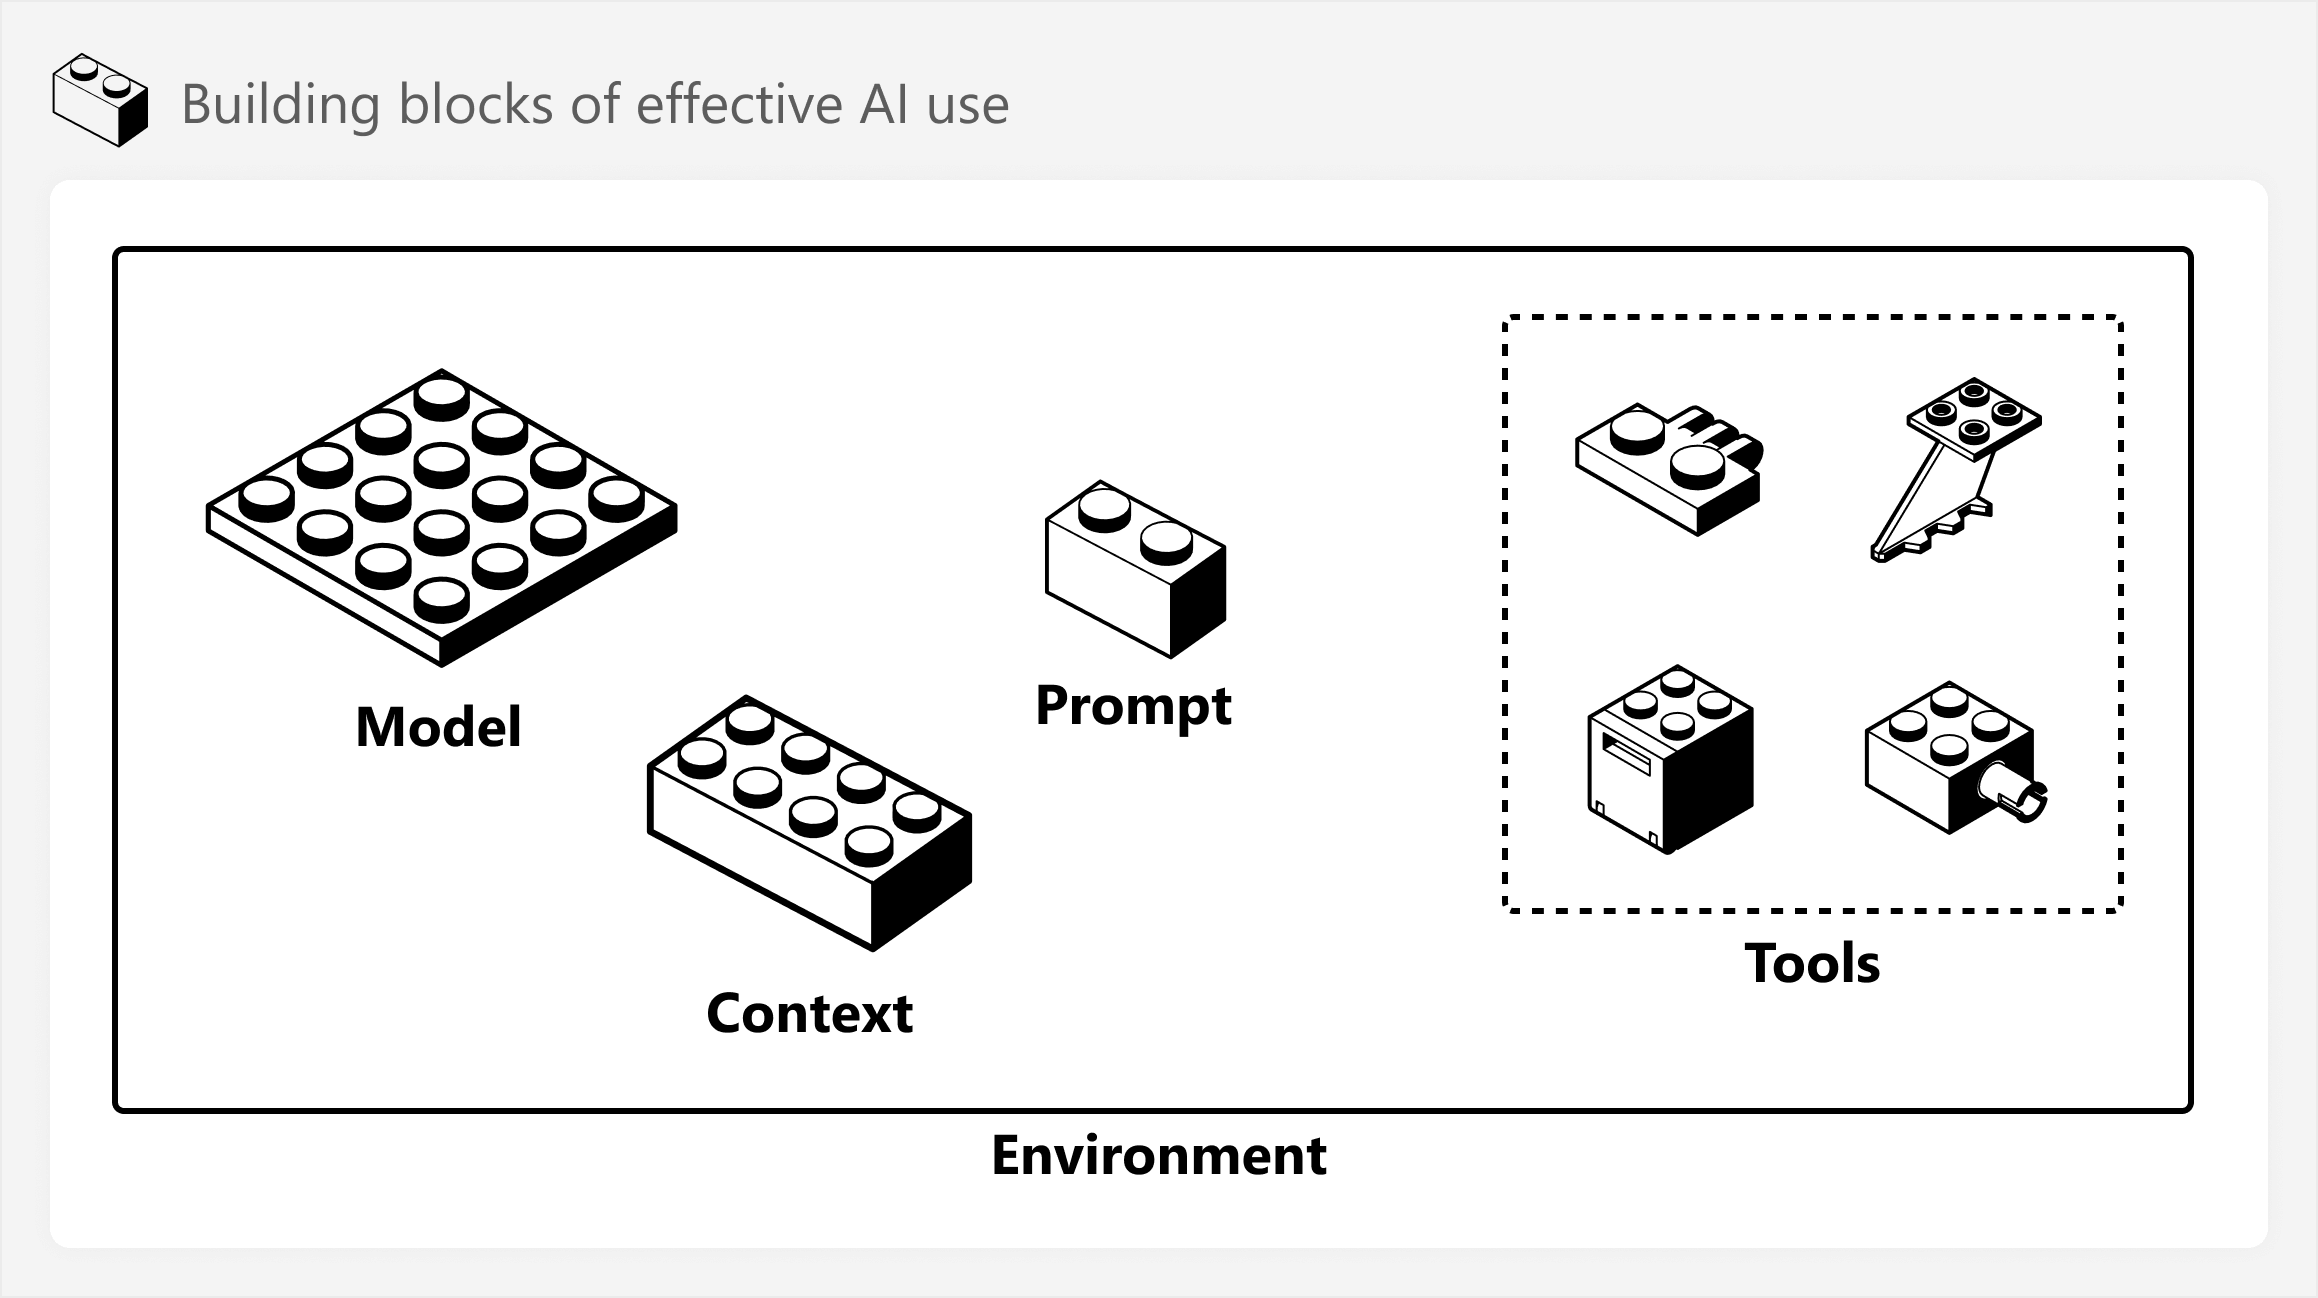
This article is about useful concepts and scenarios for integrating AI and AI agents in BI development, with specific examples for Power BI. Read more
-
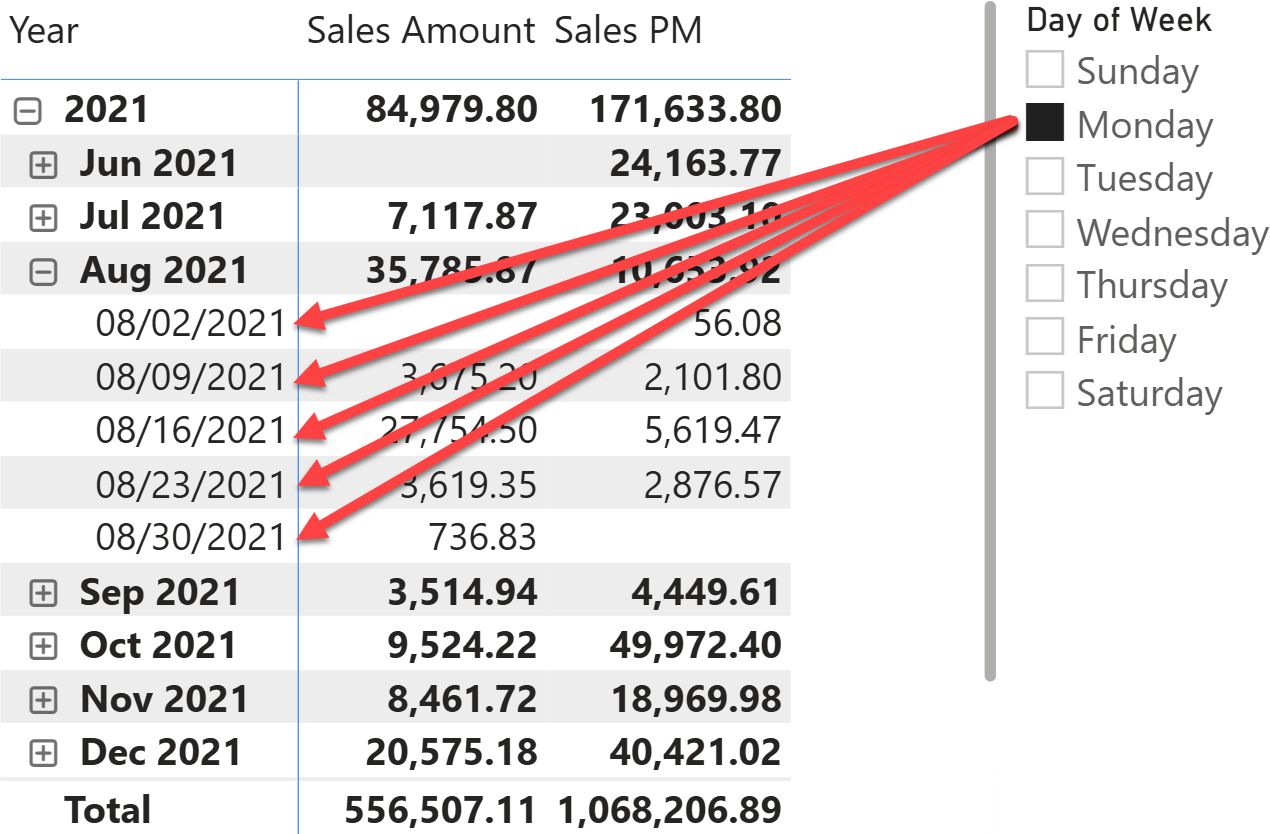
When using time intelligence functions, the automatic REMOVEFILTERS on Date can make maintaining filters on the Date table challenging. This article shows a technique to handle filter-preserving columns in DAX. Read more
-
This article describes how to control the execution of DAX code when there are either multiple or empty selections of calculation items in calculation groups. Read more
-
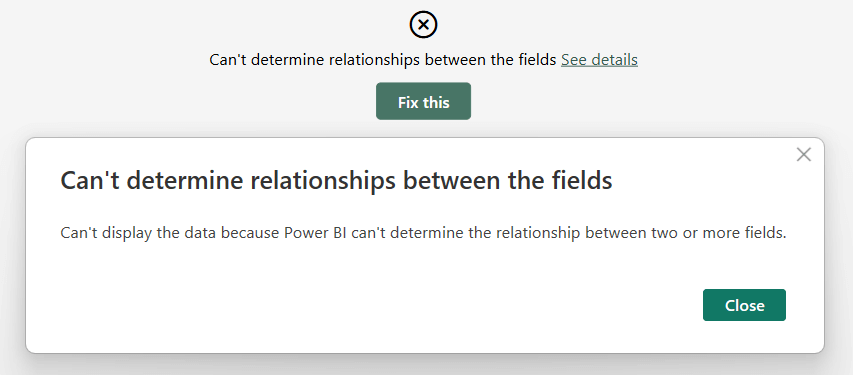
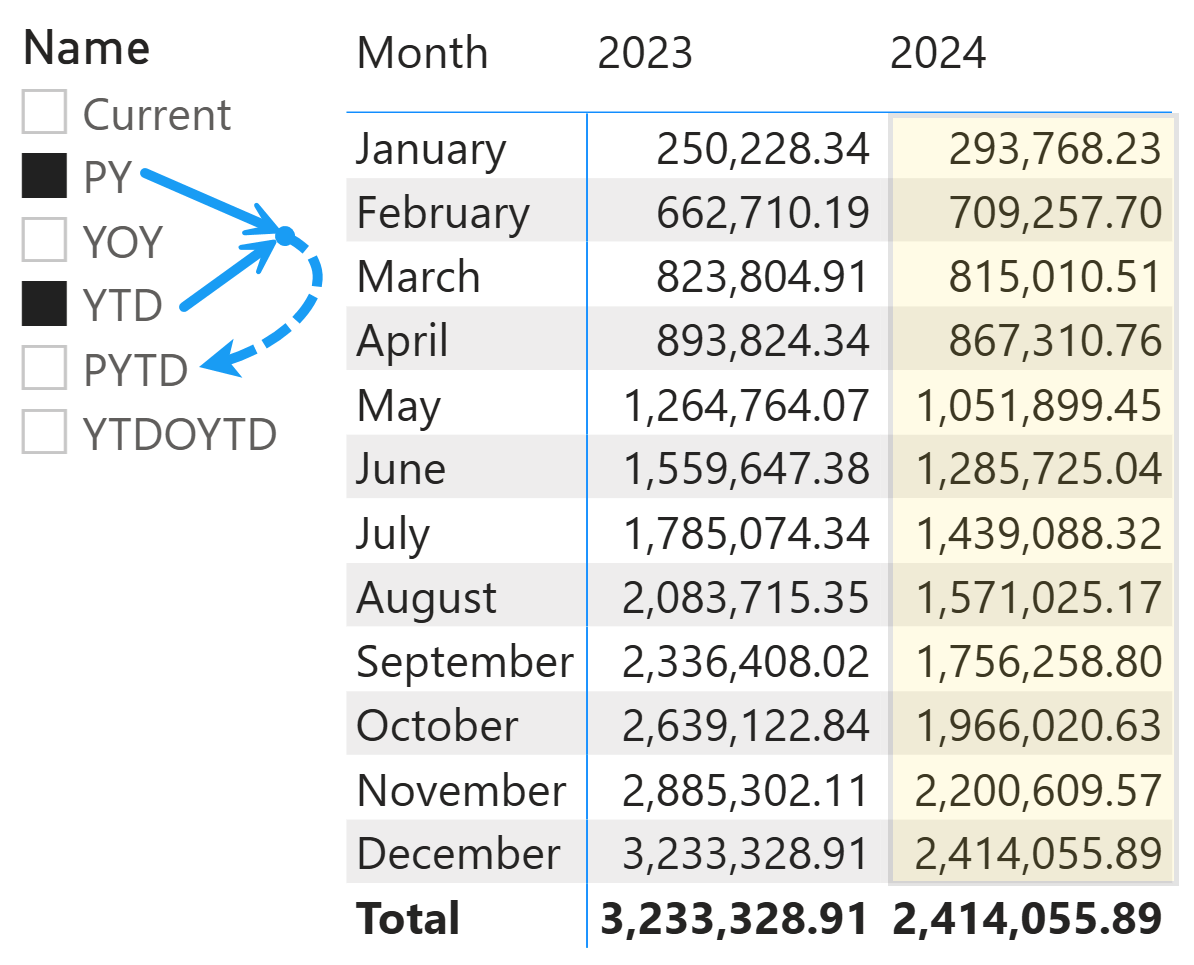
This article explains why you might encounter a curious error when placing columns from unrelated tables in a Power BI matrix. Read more
-
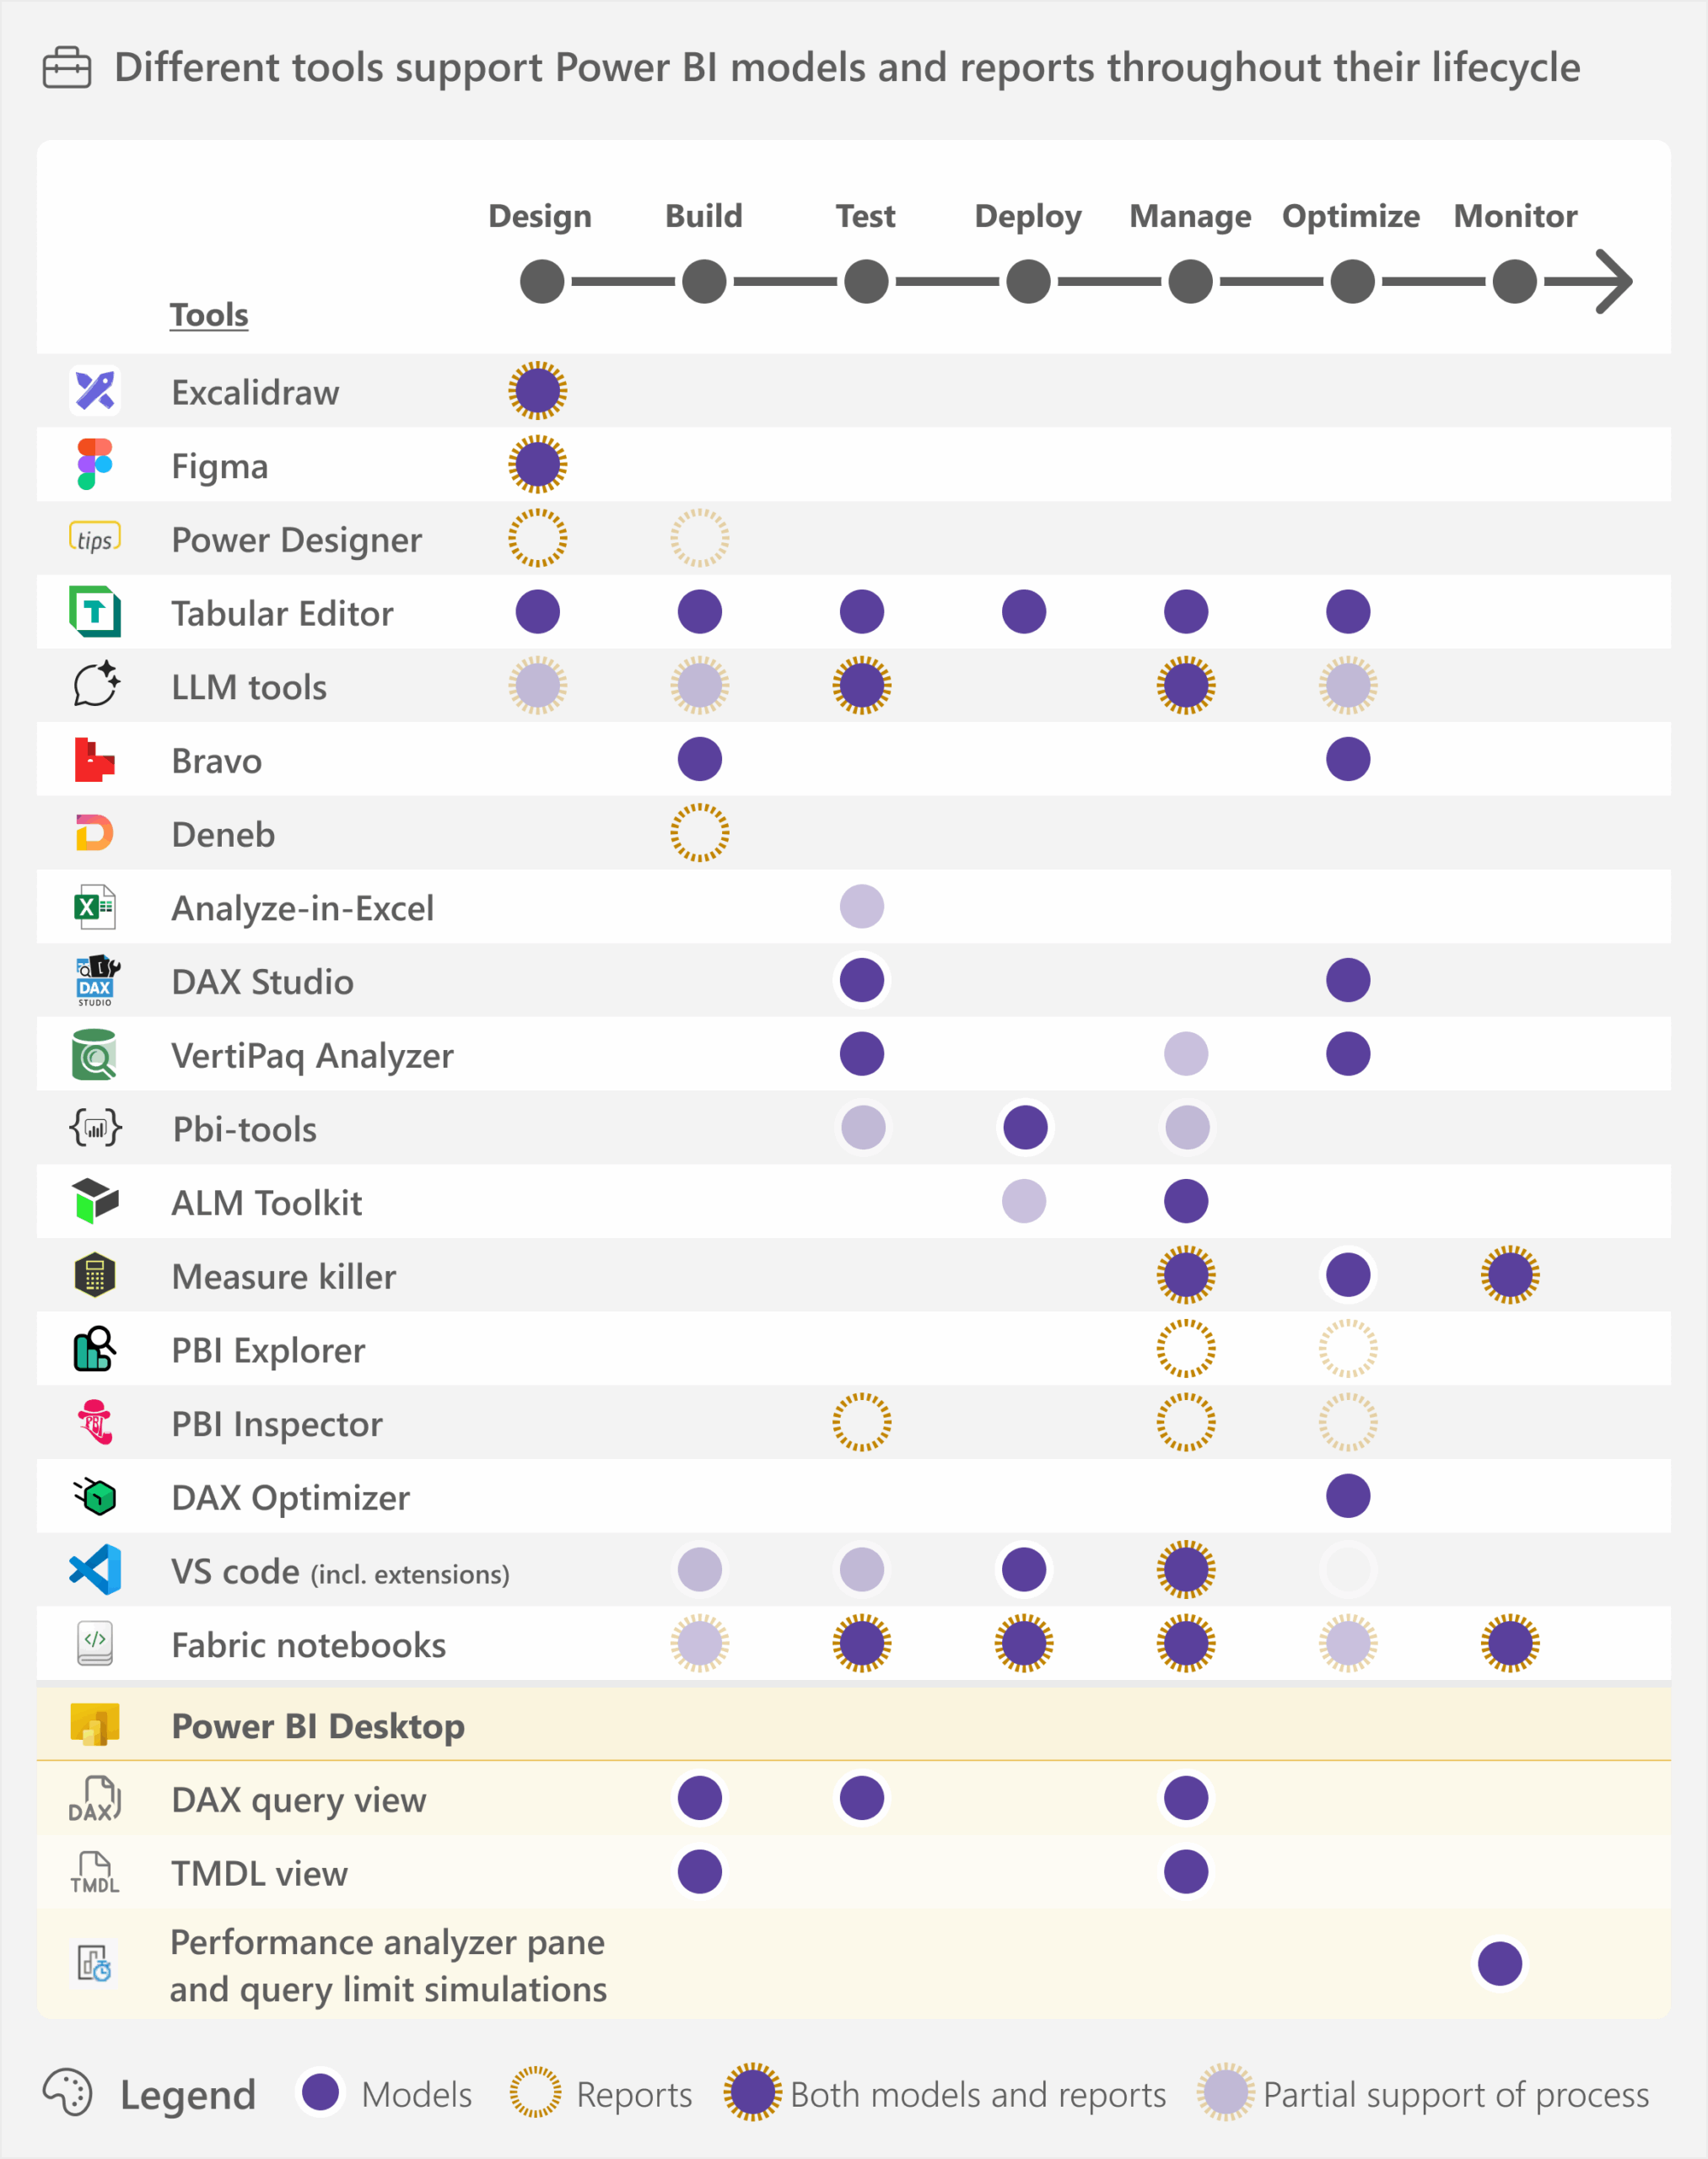
This article gives an overview of some of the available tools that can help you create semantic models and reports. Read more
-
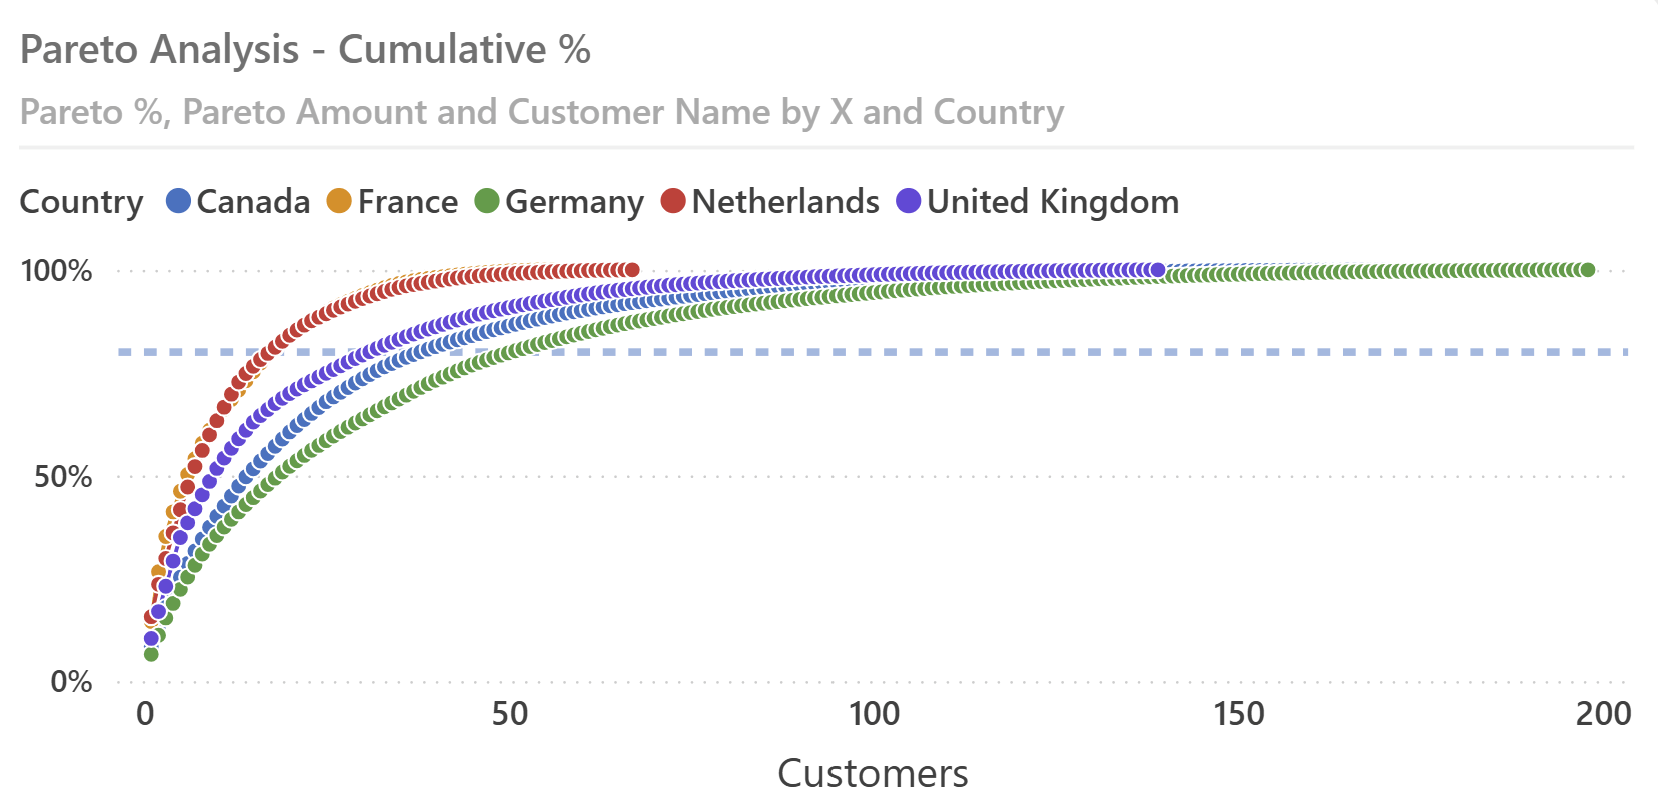
This article describes how to implement a dynamic Pareto calculation in Power BI based on a measure that can be selected from a slicer and dynamically filtered by other slicers in the report. Read more
-
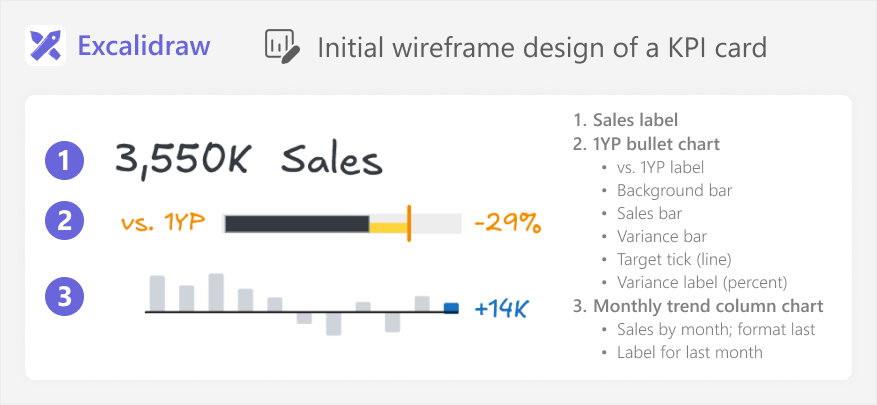
This article is about a process to use AI tools like LLMs to create custom visuals in Power BI, and how this still requires deliberate thought, planning, and learning. Read more
-
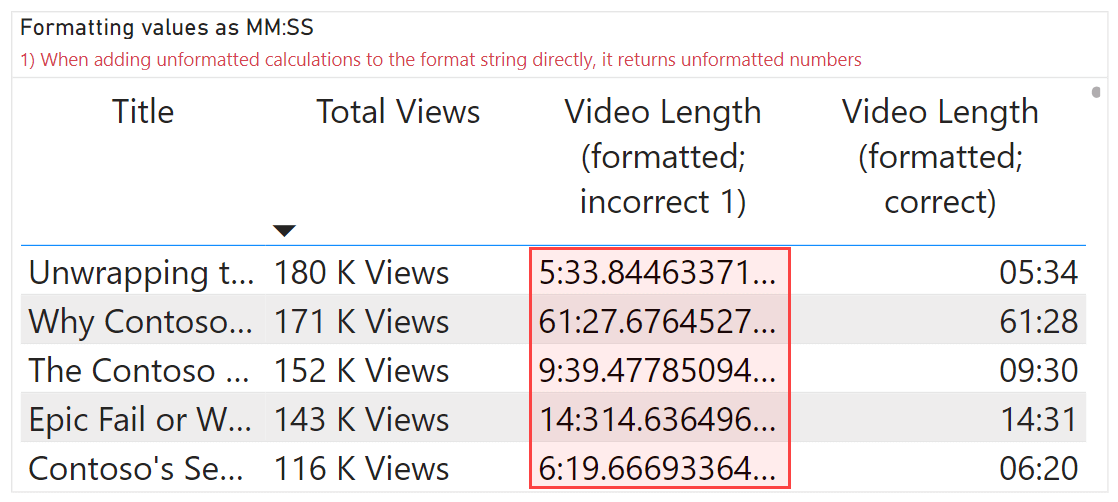
This article describes the different approaches to format your DAX measures in Power BI semantic models using custom and dynamic format strings. Read more